
The Weekly Close #0
The target for this week is a break of the triangle and a test of the 200 SMA around 23K. This idea would be invalidated with a close below the bottom of the triangle (weekly close below 18.5K)
Welcome to the very first edition of “The Weekly Close”!
Here we aim to offer a signal in the noise by looking at the weekly close for BTCUSD, what it means and what we expect to happen with the price in the coming week.
These first few editions should be considered a soft launch while we try to get in the groove. A formal launch should follow at the beginning of 2023.
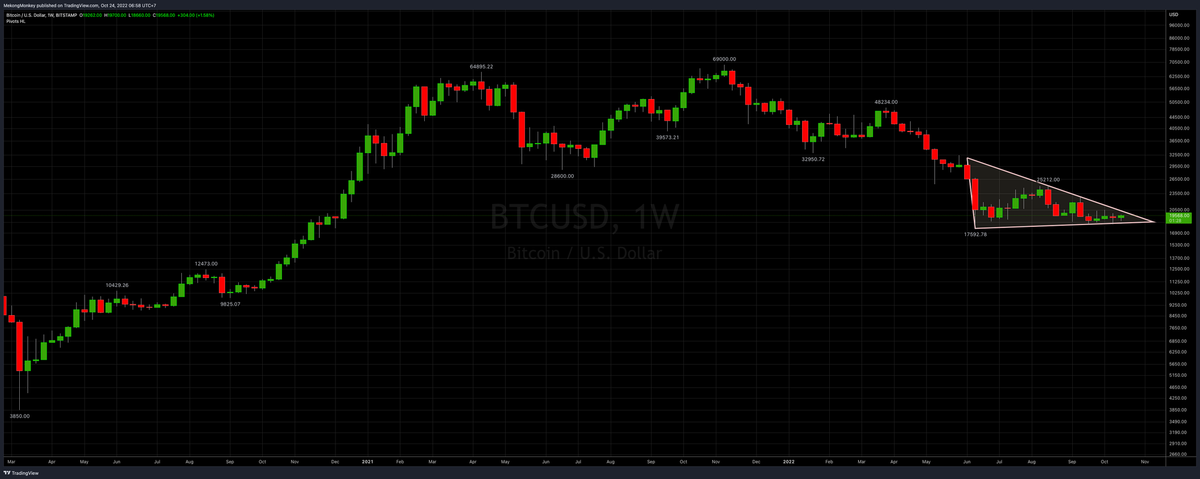
BTCUSD has been glued to the 19K level for months, forming a descending triangle in the process. The longer the consolidation lasts, the more violent the break will be. So the big question is: will we break up or down? So, let’s look at the weekly close and what we can conclude from it.
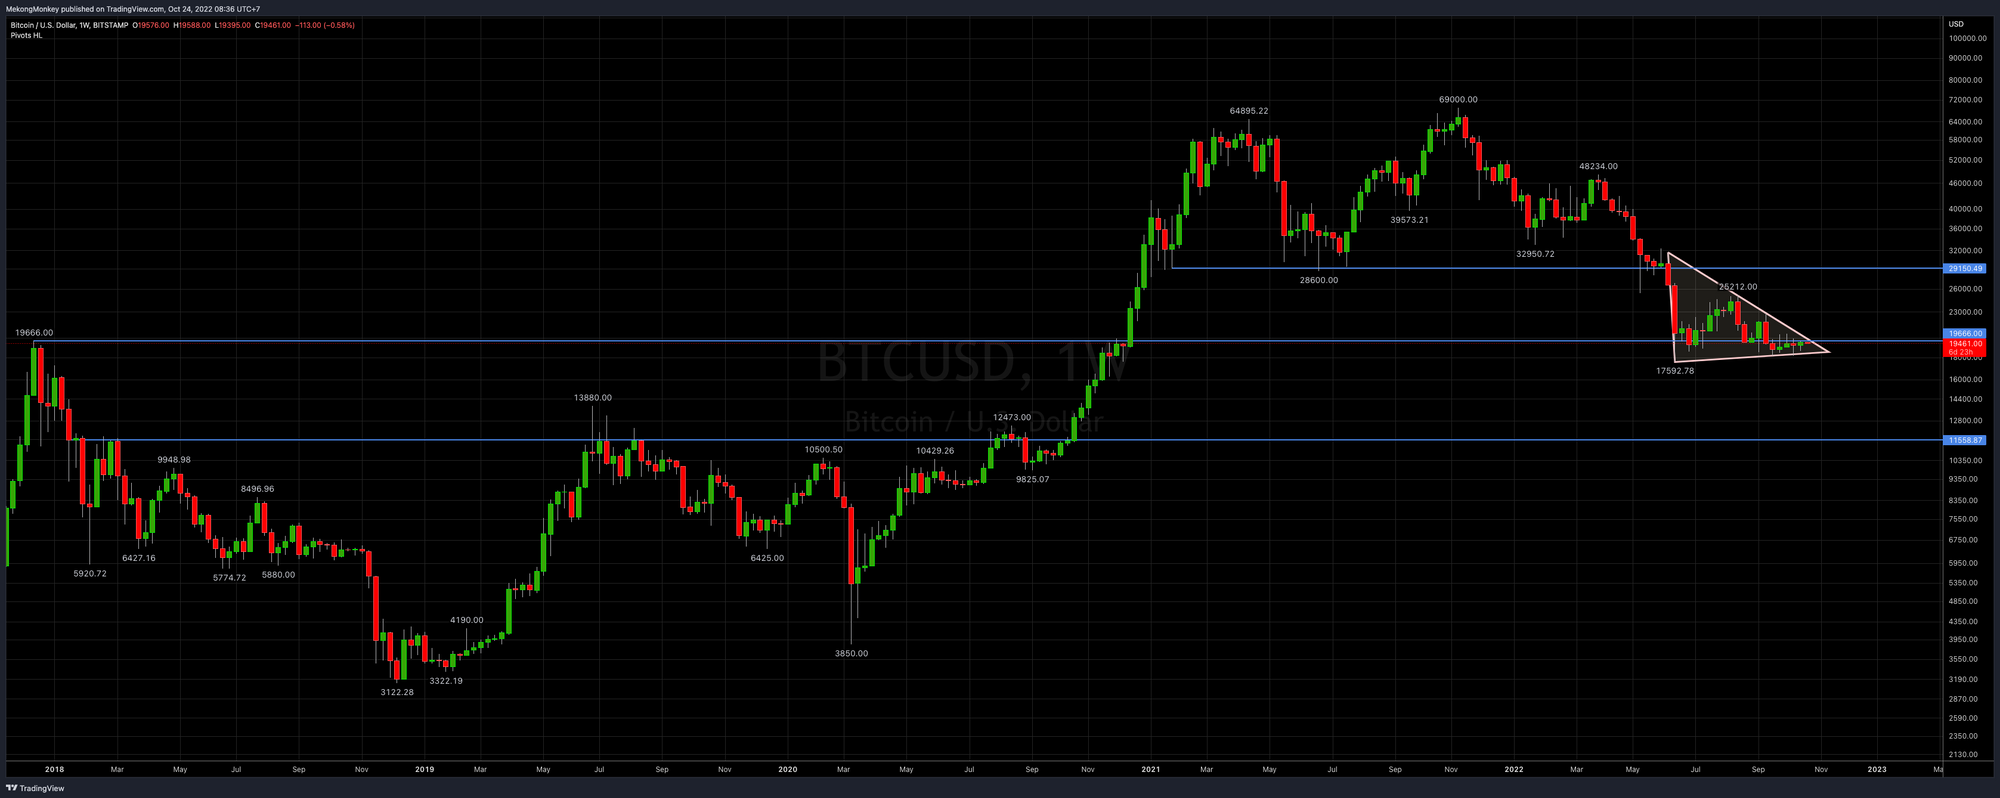
When we add in the nearest significant horizontal support- and resistance levels (HSR), the picture looks like this:
Since June, Bitcoin has been consolidating around the 2017 all-time high (ATH). It’s pretty impressive that we have been able to hold this level amidst all the general macro market turmoil.
A downwards break of the triangle would send the price toward 12K with very little support between here and there. A break through the upside would bring us back on the path to 30K, but there’s some serious resistance on the way:
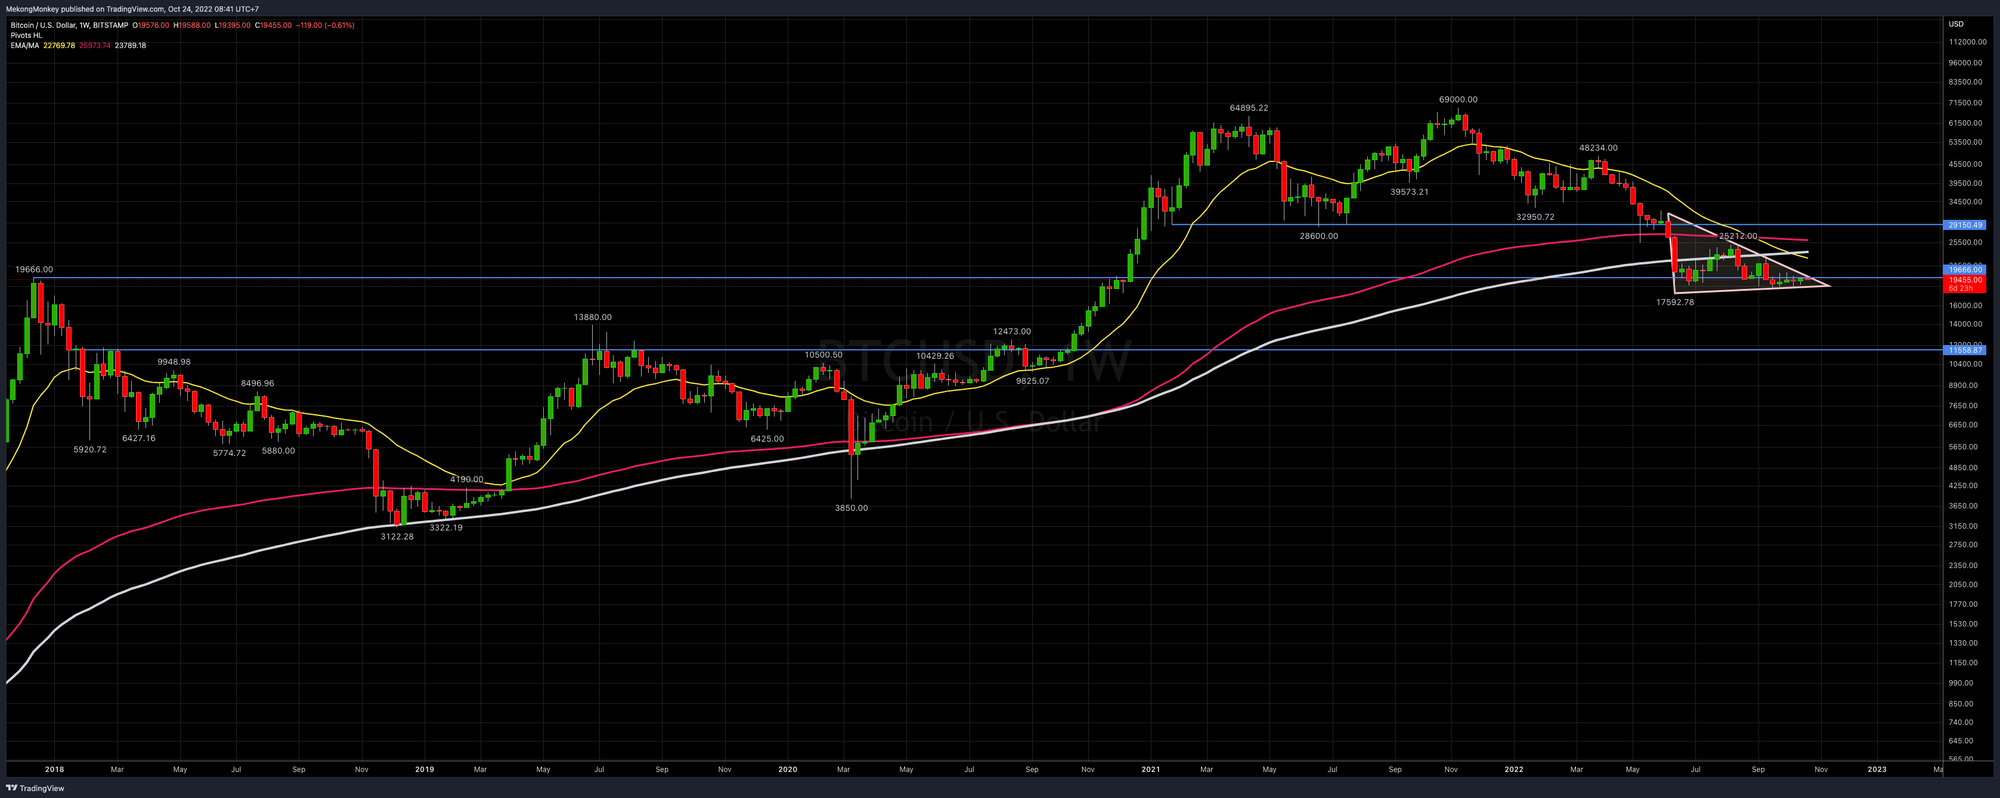
The 21 EMA (exponential moving average, yellow), the 200 SMA (simple moving average, white), and the 200 EMA (red) are all overhead resistances.
Finally, let’s look at our favorite momentum indicator; the RSI:
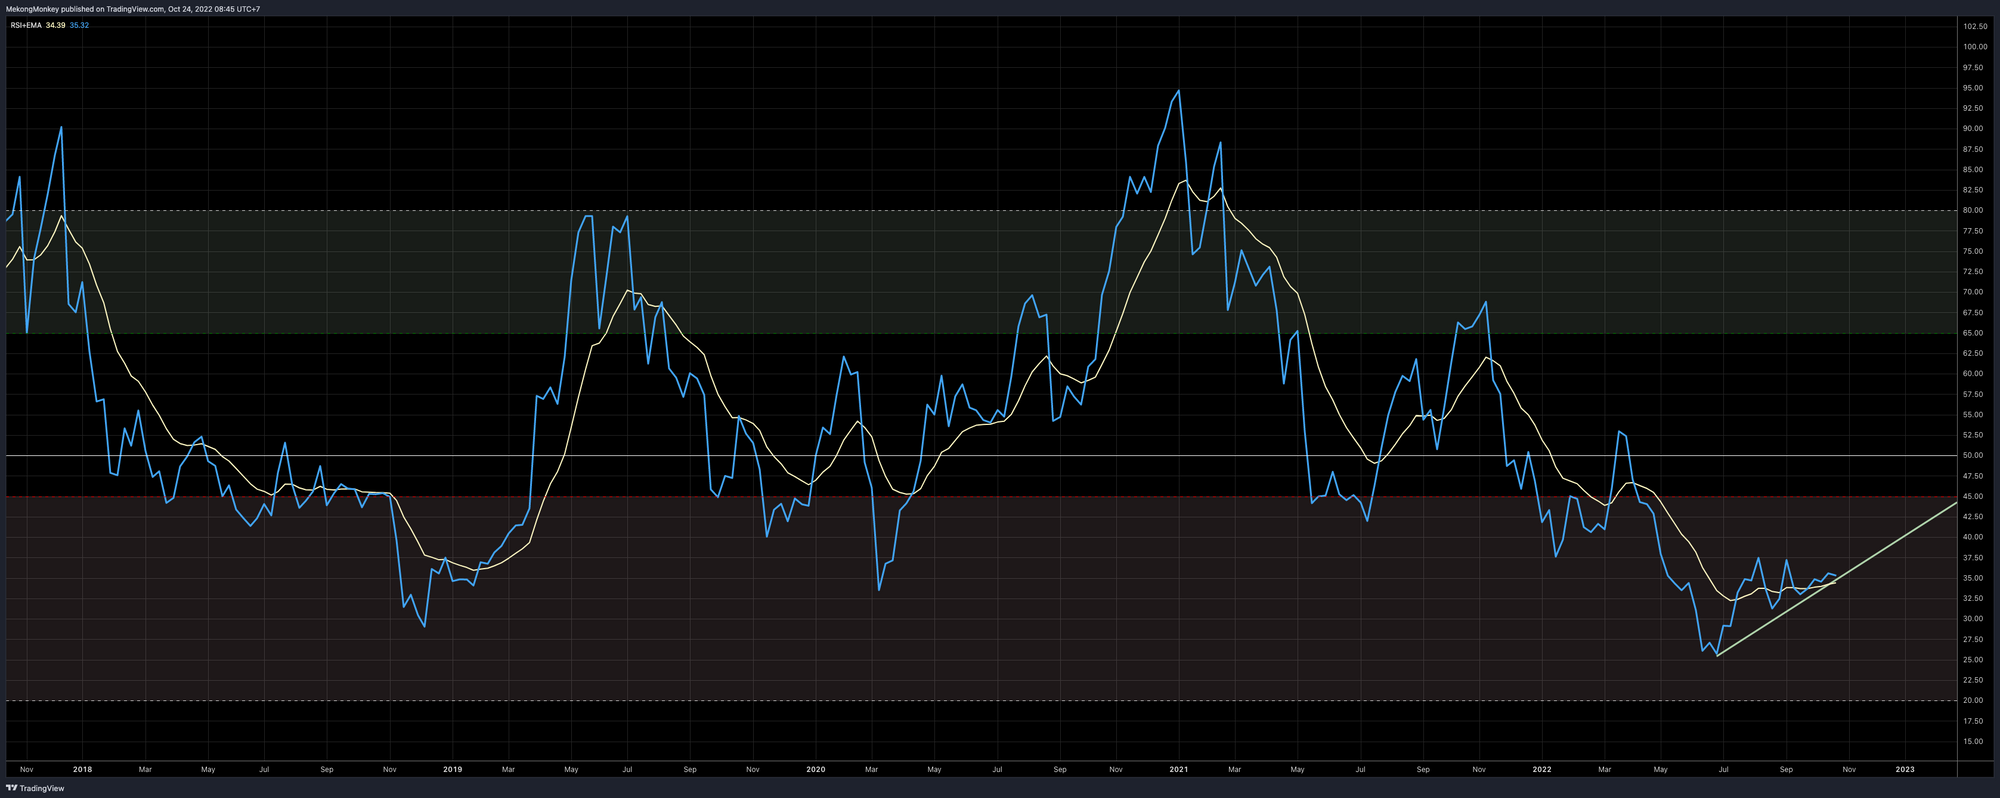
While the price has been consolidating around 19K, the RSI has bottomed and started a nice uptrend. This could provide a clue for things to come.
To bring it all together:
BTCUSD is still consolidating, but a significant move is imminent, probably this week. Given that we’ve been holding this level for months while the macro is very much bearish and the RSI has been grinding higher, a breakout to the upside is more likely than a breakdown to the downside.
The target for this week is a break of the triangle and a test of the 200 SMA around 23K. This idea would be invalidated with a close below the bottom of the triangle (weekly close below 18.5K)
Thank you for reading! This is just a first attempt, and this analysis will improve and get more streamlined in the coming weeks.
Not trading advice. You are solely responsible for your actions and decisions.