
The Weekly Close #21: Preparing for lift-off
With bitcoin back above the 200-week SMA, much higher prices are the most likely path forward.
Dear friends,
Welcome to a new edition of The Weekly Close, where we look at the weekly chart of BTCUSD to figure out what’s ahead for the bitcoin price. Let’s dive right in!
📉 The weekly bitcoin chart
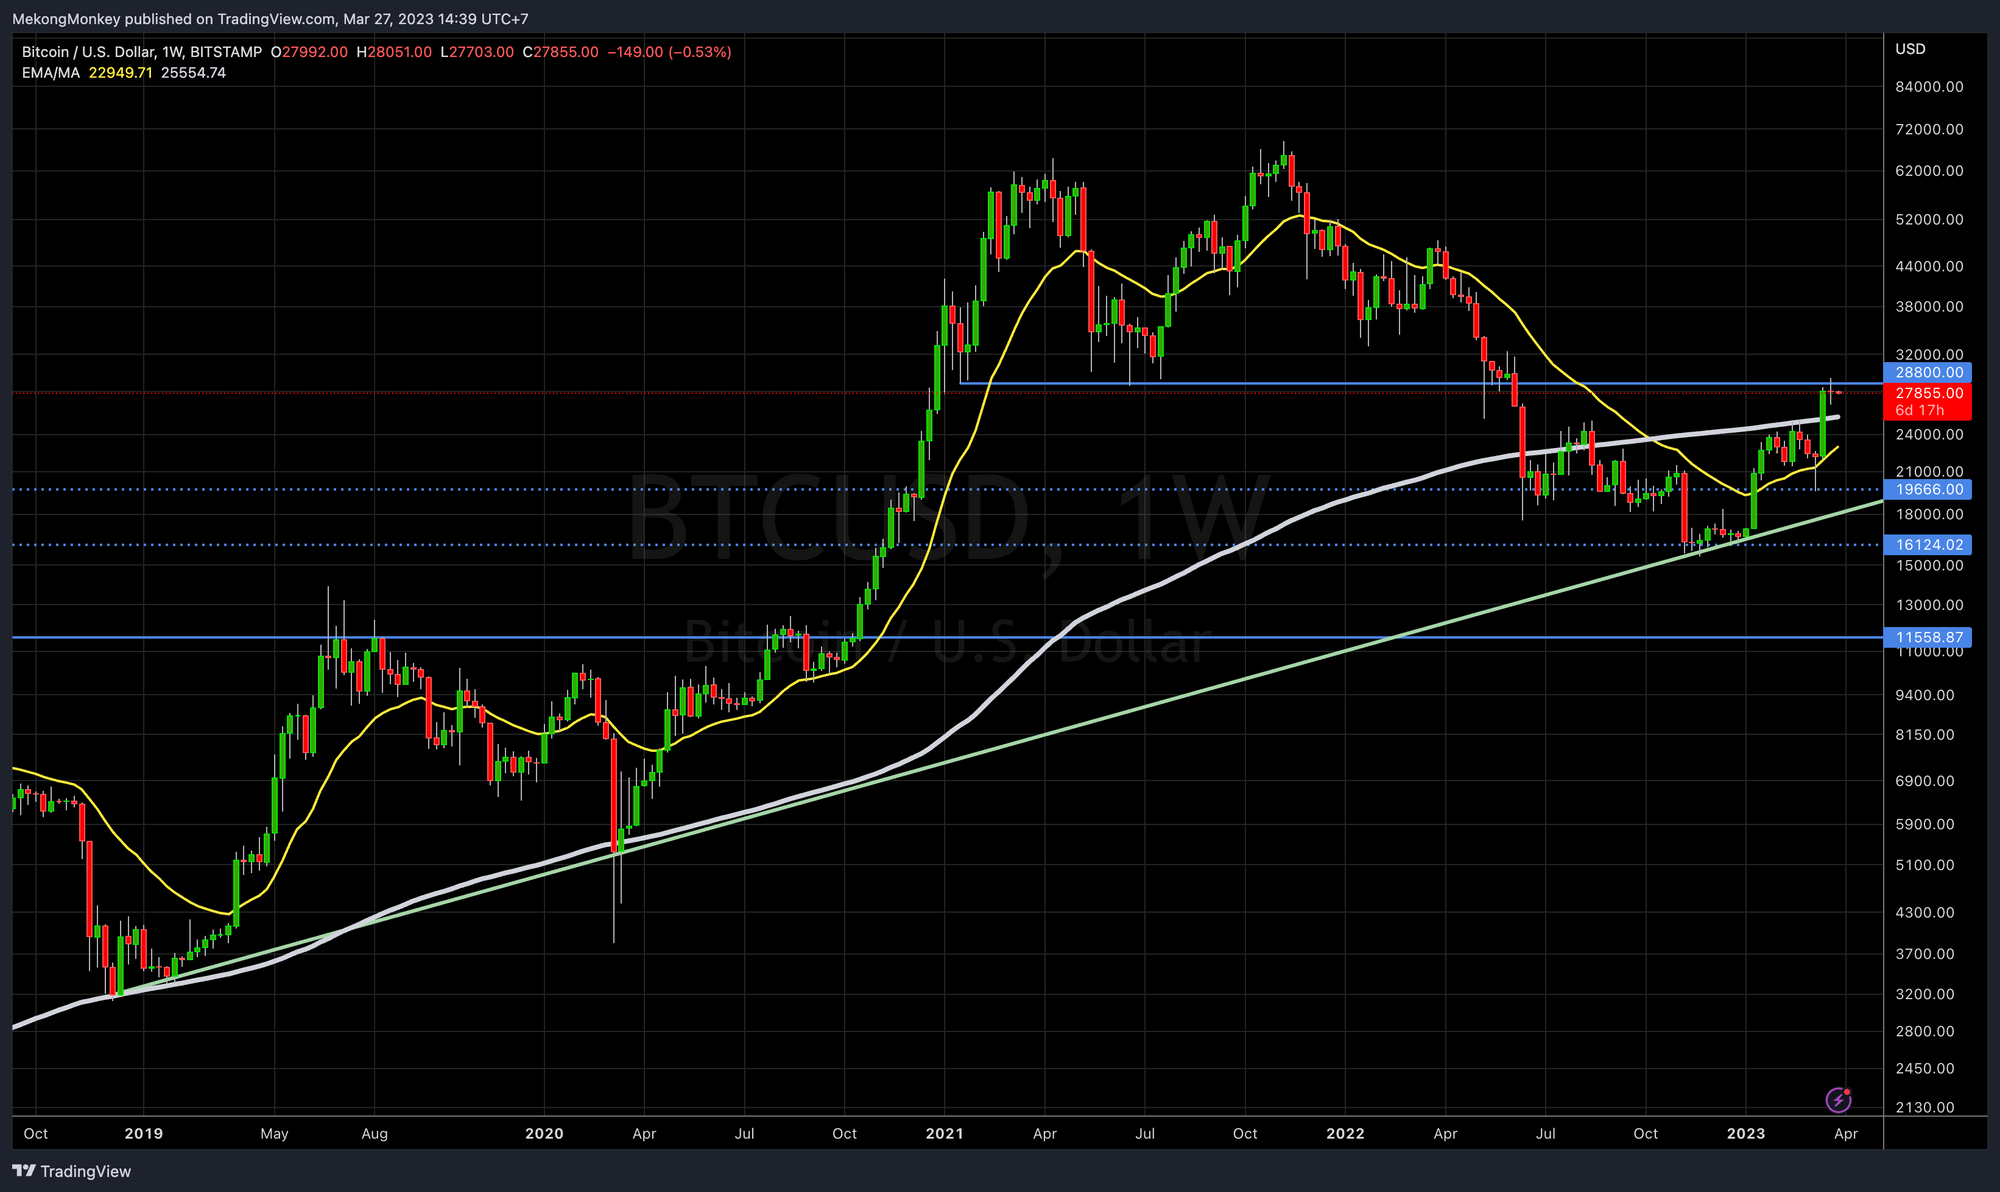
The chart looks the same as a week ago: BTCUSD broke up through the 200-week Simple Moving Average (SMA, in white) and reached the top of the $12K to $28.8K range (blue horizontals). Although the price pierced through the final resistance level, the week closed below $28.8K, leaving the level unbroken for now.
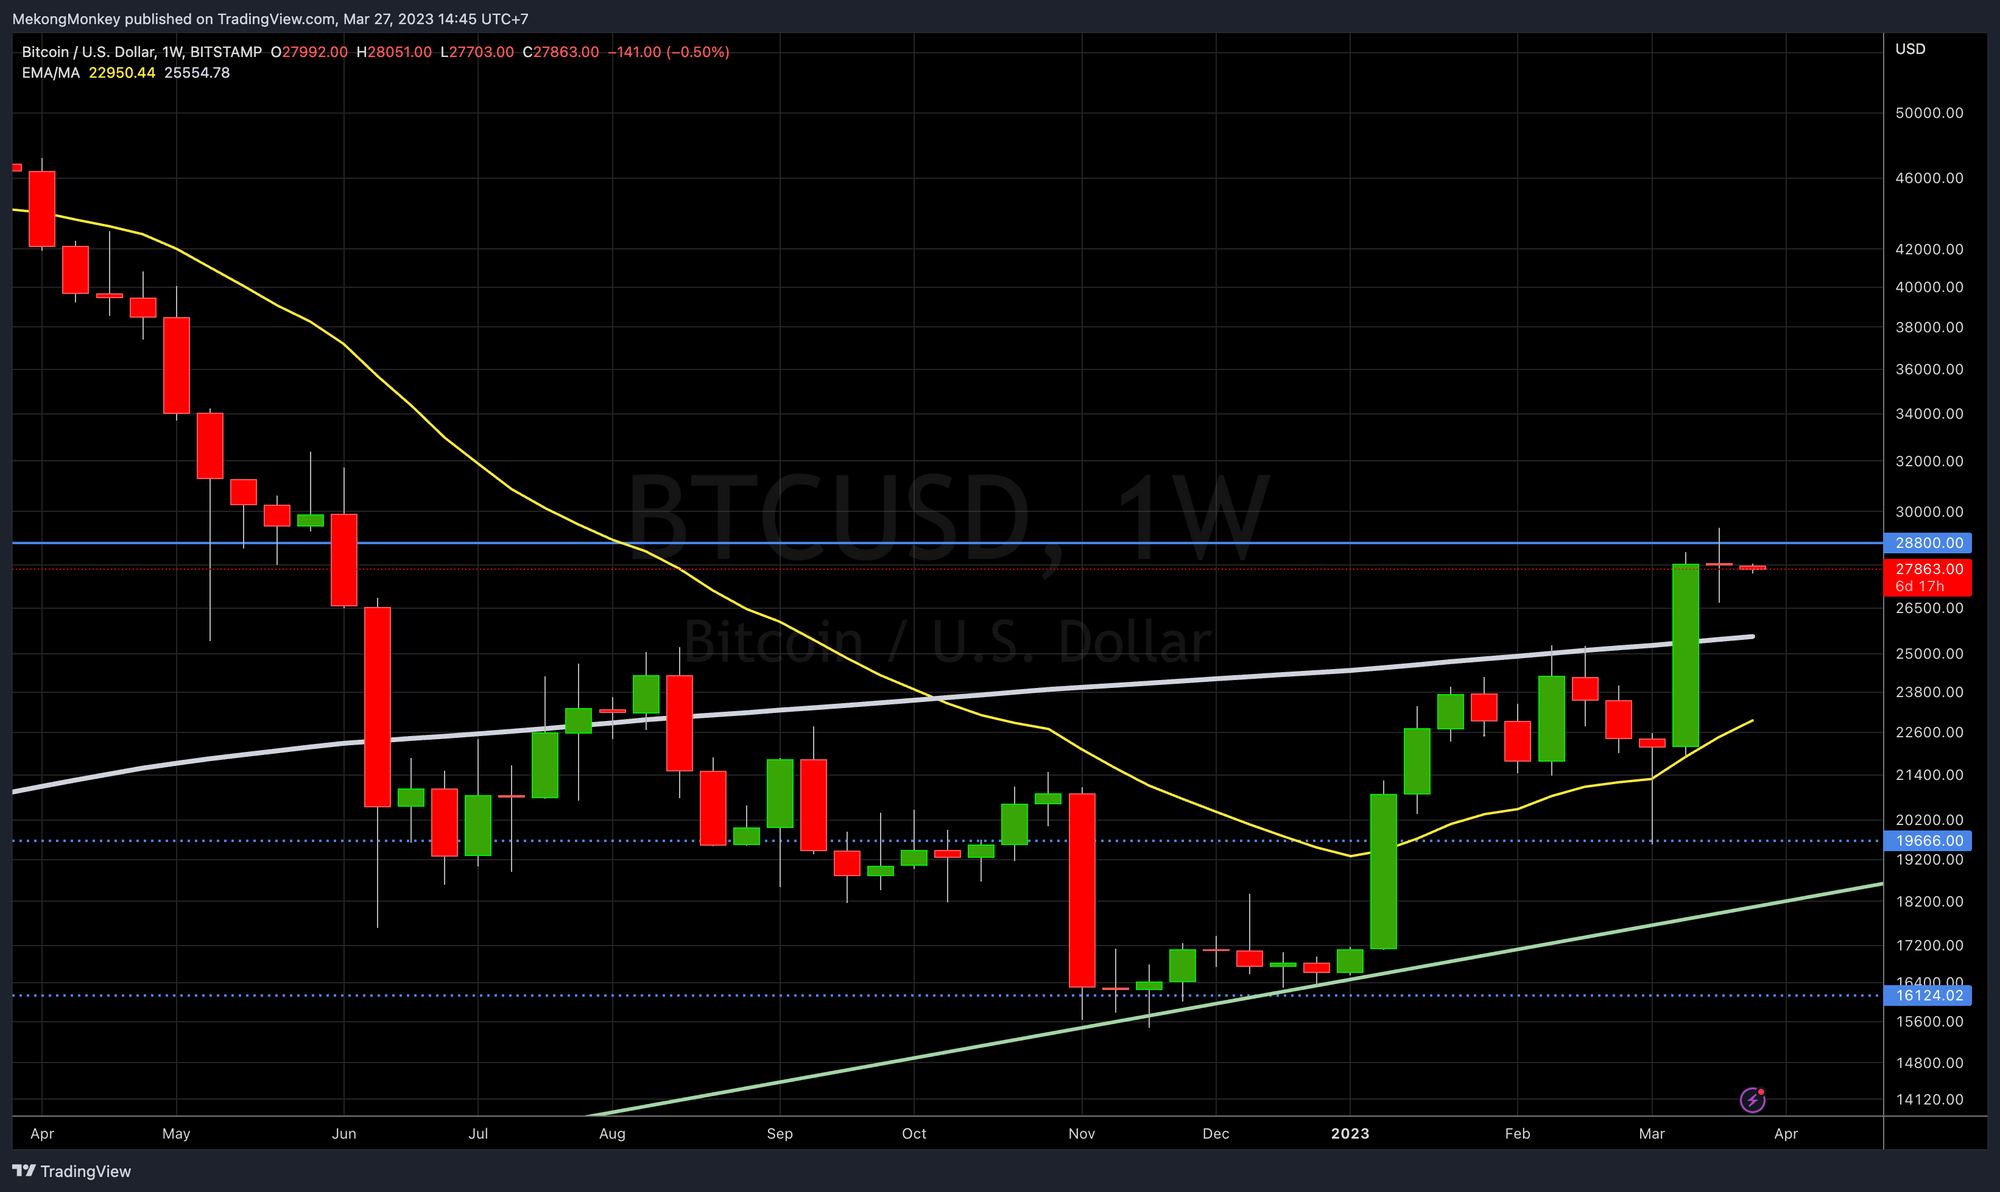
The break out above the 200 SMA looks very healthy. Bitcoin made a clean higher high and has ended nine months of consolidating below the 200-week SMA.
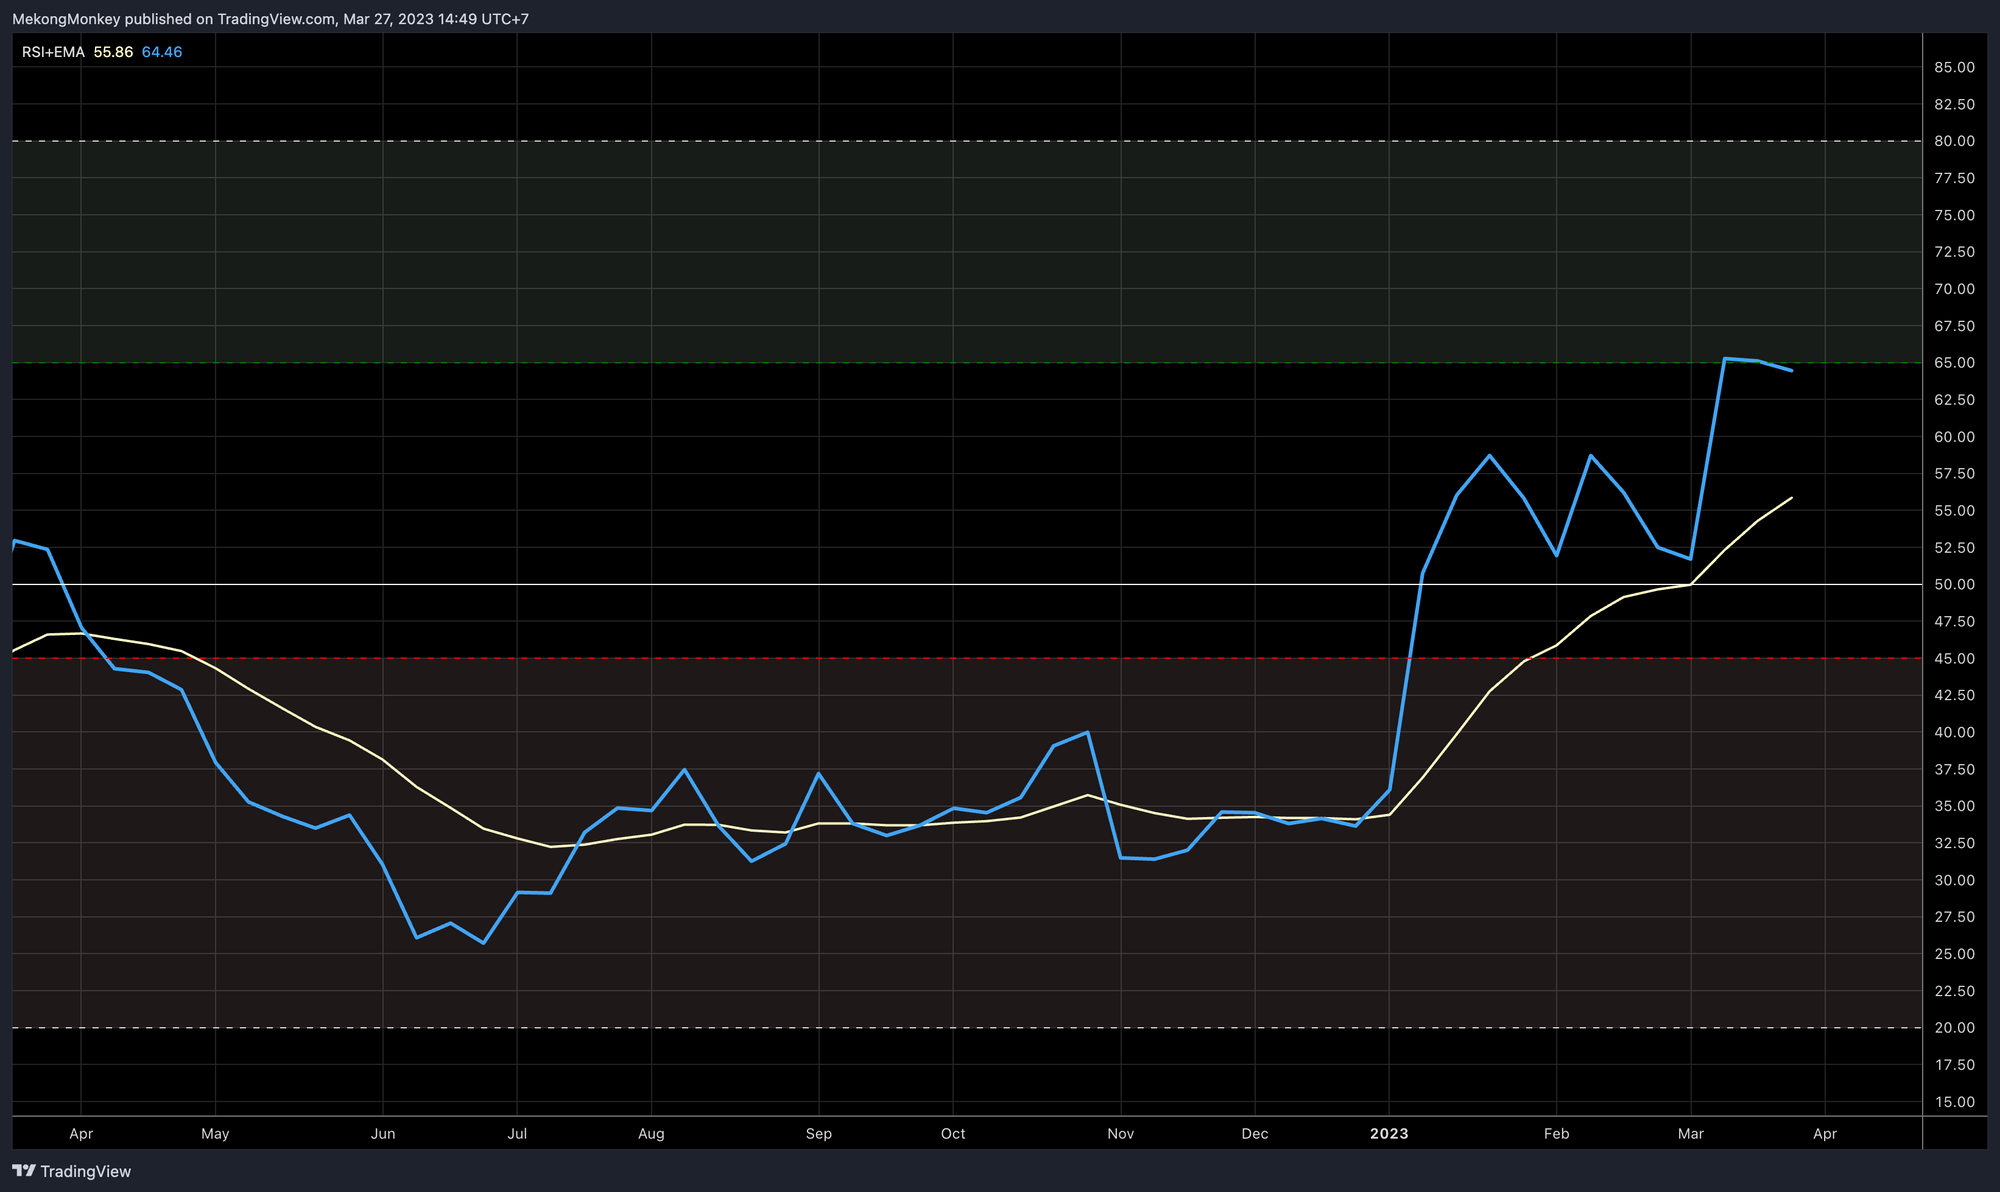
According to the Relative Strength Index (RSI), the momentum is also healthy. We can’t get a foothold in the bullish control area (the green zone) just yet. Nevertheless, the RSI is in a solid uptrend since the beginning of the year and remains in excellent condition for a sustained bull run.
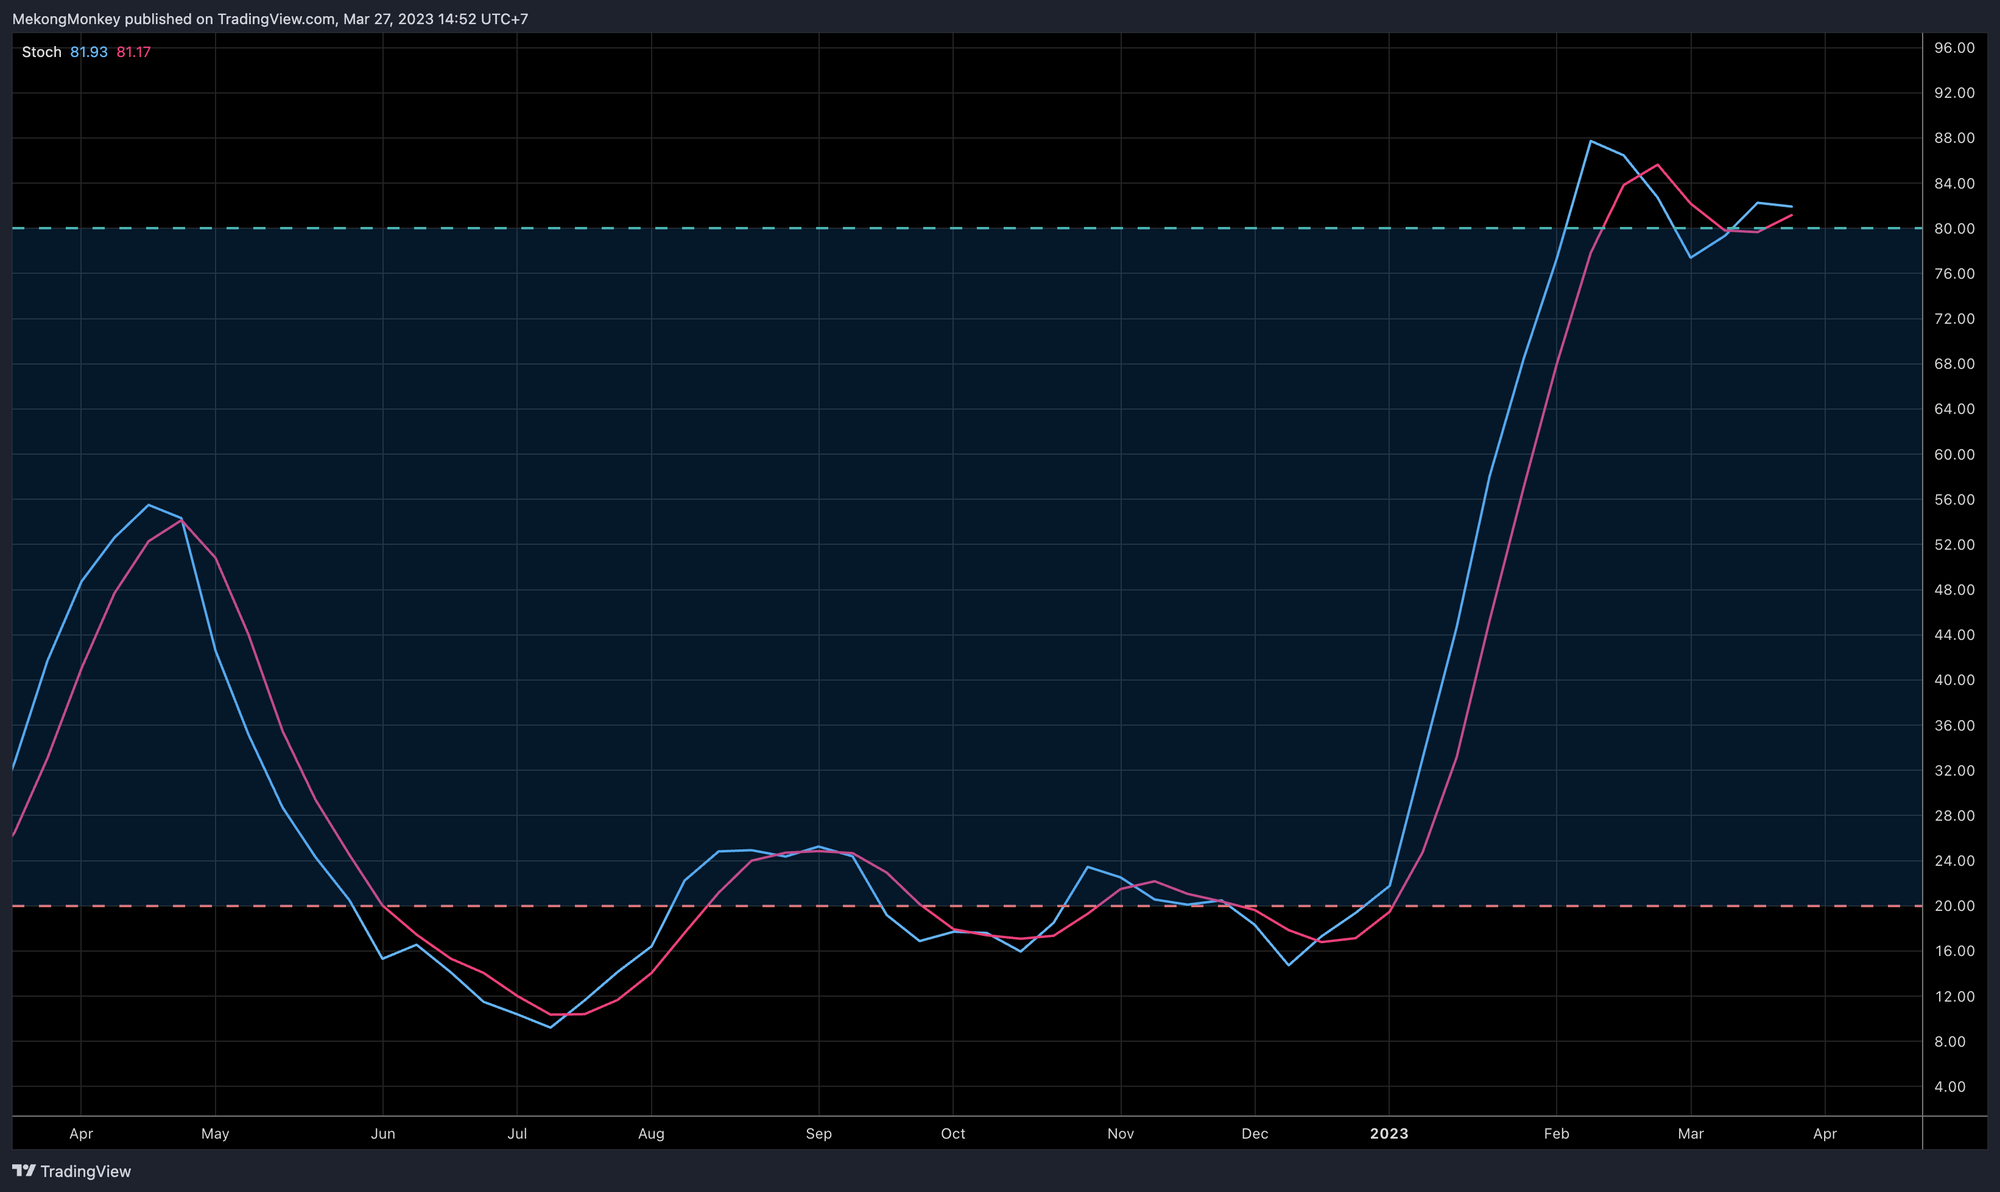
The Stochastic Oscillator (Stoch) keeps snaking around the overbought level of 80. However, the lack of a pullback shows that the bulls are in solid market control.
🔮 To bring it all together:
With bitcoin back above the 200-week SMA, much higher prices are the most likely path forward.
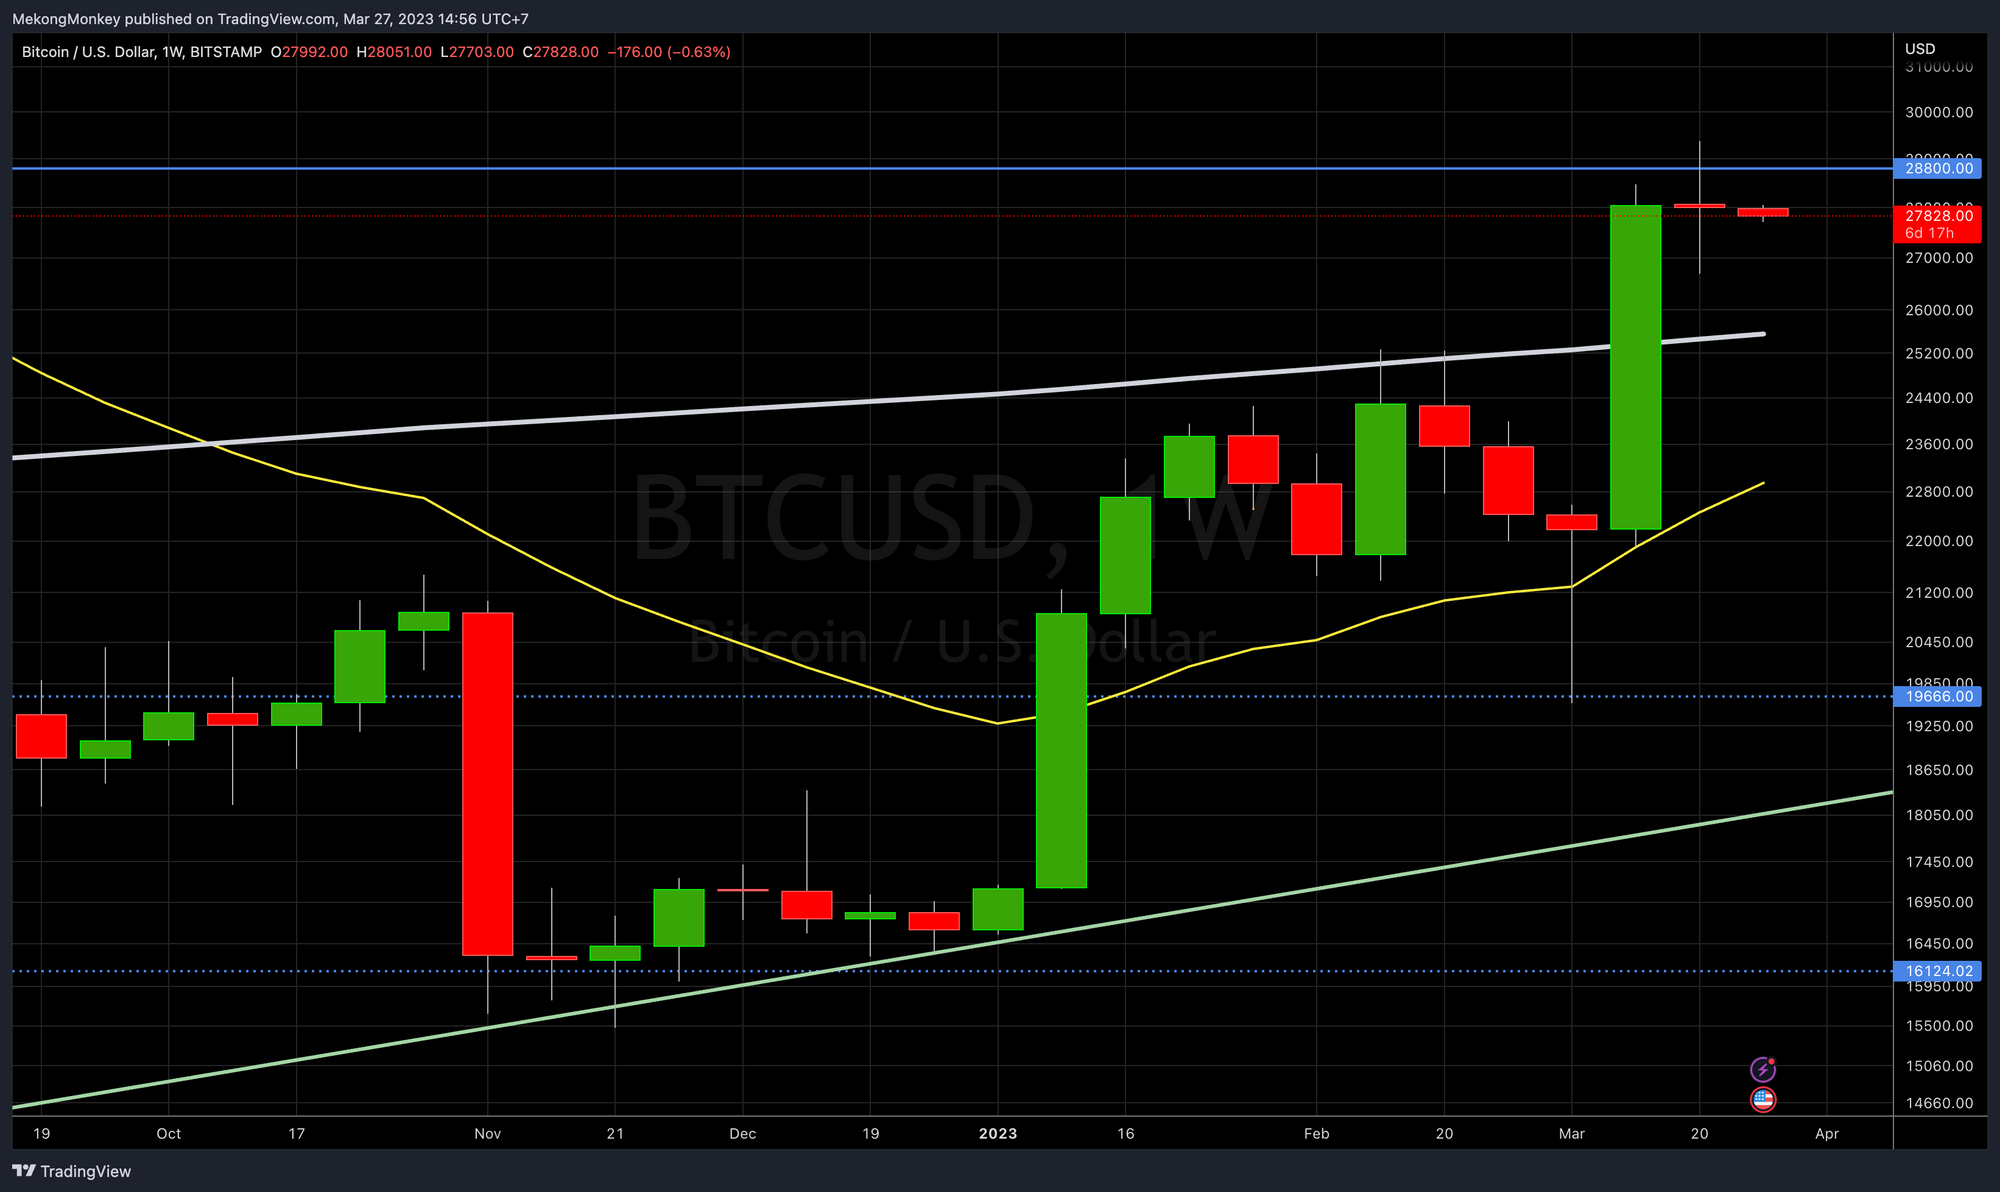
The last line of Resistance remains unbroken at $28.8K. A pullback towards the 200 SMA, around $25K, is a likely path before attempting another break of this final Resistance level. A deeper pullback to the 21-week Exponential Moving Average (SMA, in yellow - currently around $23K) could happen, but a weekly close below the 200 SMA seems improbable.
Further consolidation is expected, with most of the price action probably between the 200 SMA ($25.5K) and the overhead Horizontal Resistance ($28.8K), eventually followed by a break of Resistance towards higher and higher prices.
Best of luck to Greenpeace 🤣
Greenpeace has a master plan to change bitcoin’s code. Here is the team that’s gonna make it happen:
— hodlonaut 13%er 🌮⚡🔑 🐝 (@hodlonaut) March 24, 2023
Companies ✅
Government officials ✅
Crypto enthusiasts ✅
Climate activists ✅
Can’t wait to read the BIP 😂
Good luck, guys! pic.twitter.com/feqKTfxFJh
Have a wonderful week, dear friends; take good care of yourself and your loved ones. You can reach us on Twitter, Telegram, or e-mail with any comments, questions, or suggestions.
Nostr pub key: npub1v5jycyudhv64tm4q66vjeqcvxrpgk6u507xypt44cc55ghyh7mqq42suxz
Greetings from the road, somewhere in Europe, and talk again soon!

Support The Weekly Close by using these excellent services:
- HodlHodl: buy and sell bitcoin peer-to-peer without counterparty risk.
- Rollbit: up to 1000X bitcoin leverage futures. Instant execution. 0% Slippage. 0% Fees on loss.
- Satsback: earn sats when shopping online.
We appreciate your support! ⚡MekongMonkey@stacker.news
Not trading advice. You are solely responsible for your actions and decisions.