
The Weekly Close #20: Over the moon
Bitcoin reclaims the 200-week Simple Moving Average. The future is looking bright and orange.

Dear friends,
Welcome to the latest edition of The Weekly Close. Bitcoin has reached our target for the year, closing at $28K. Let's look at how we got here and what we can expect in the week ahead.
📈 The weekly bitcoin chart
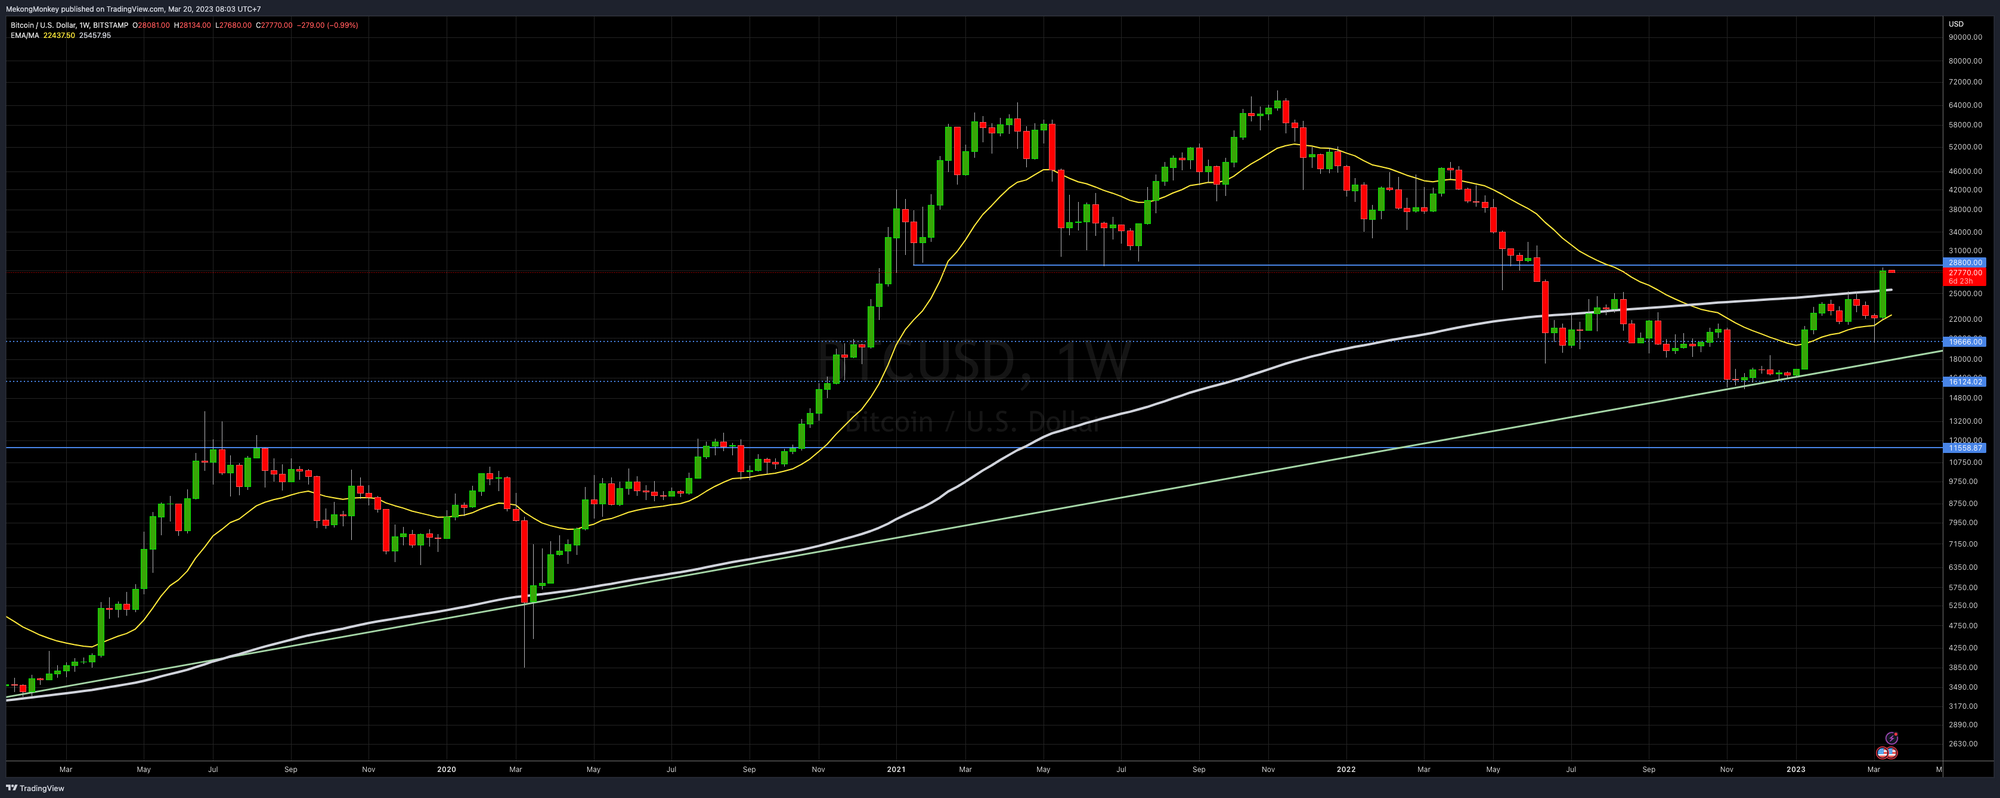
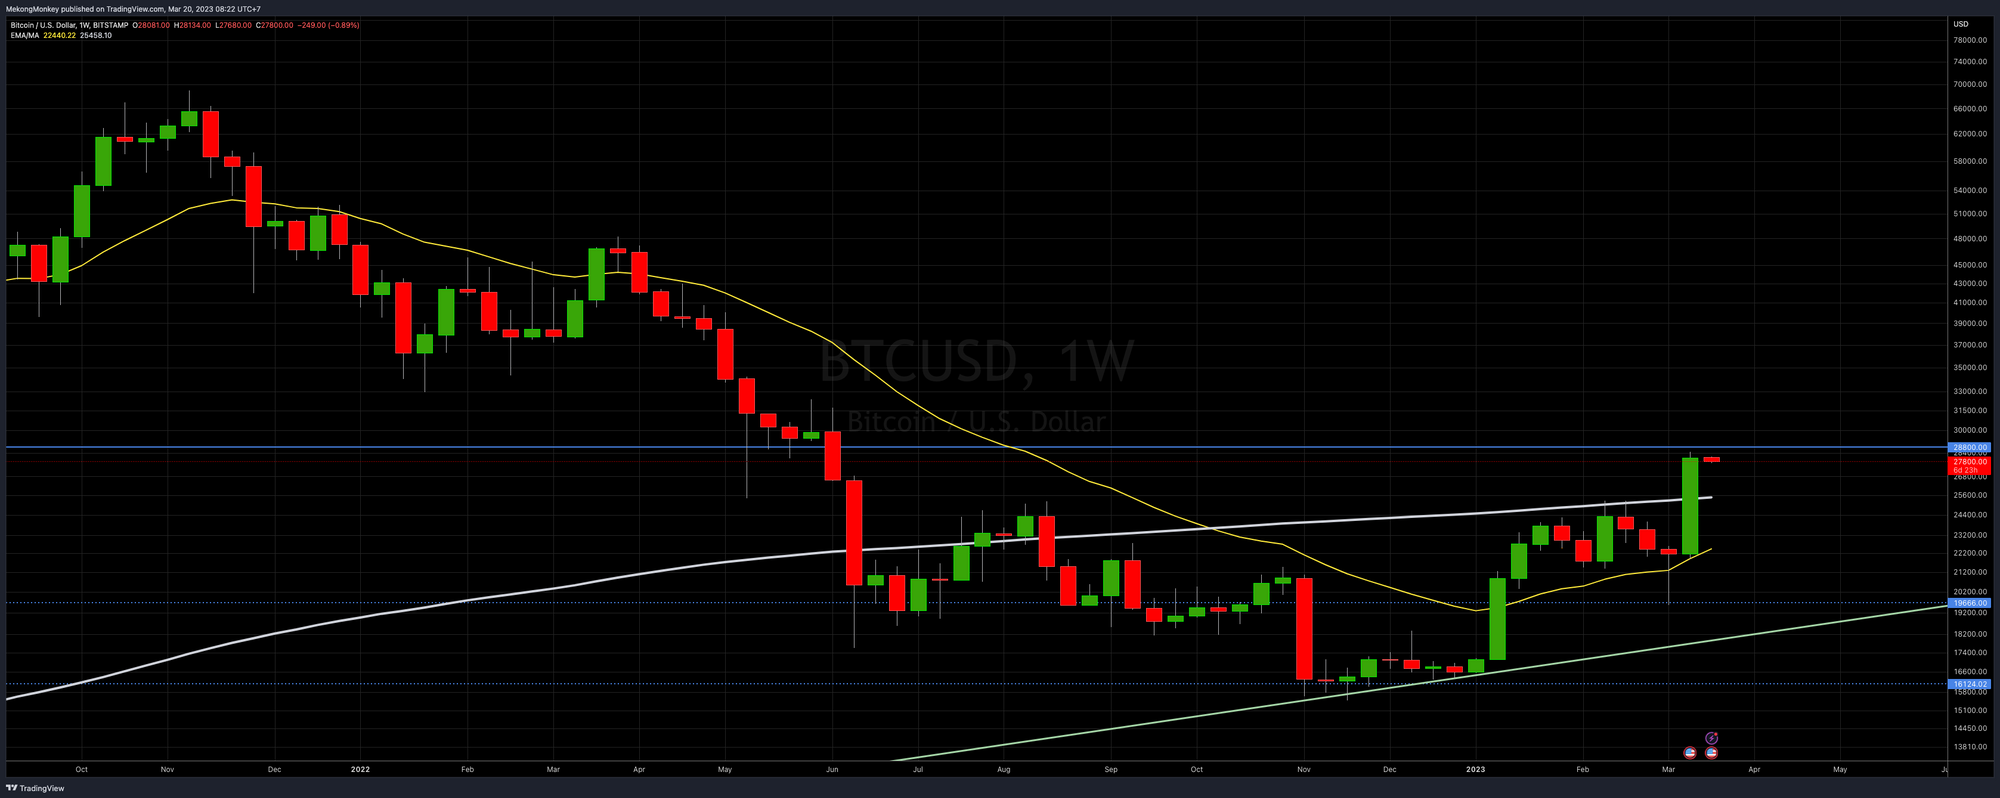
This is the weekly chart of BTCUSD. By now, you probably know what it all means, but just in case, here's a quick overview of the different lines and indicators: significant Horizontal Support Resistance (HSR) levels in blue, the bullish trend line in green, the 21-week Exponential Moving Average (EMA) in yellow and the 200-week Simple Moving Average (SMA) in white.
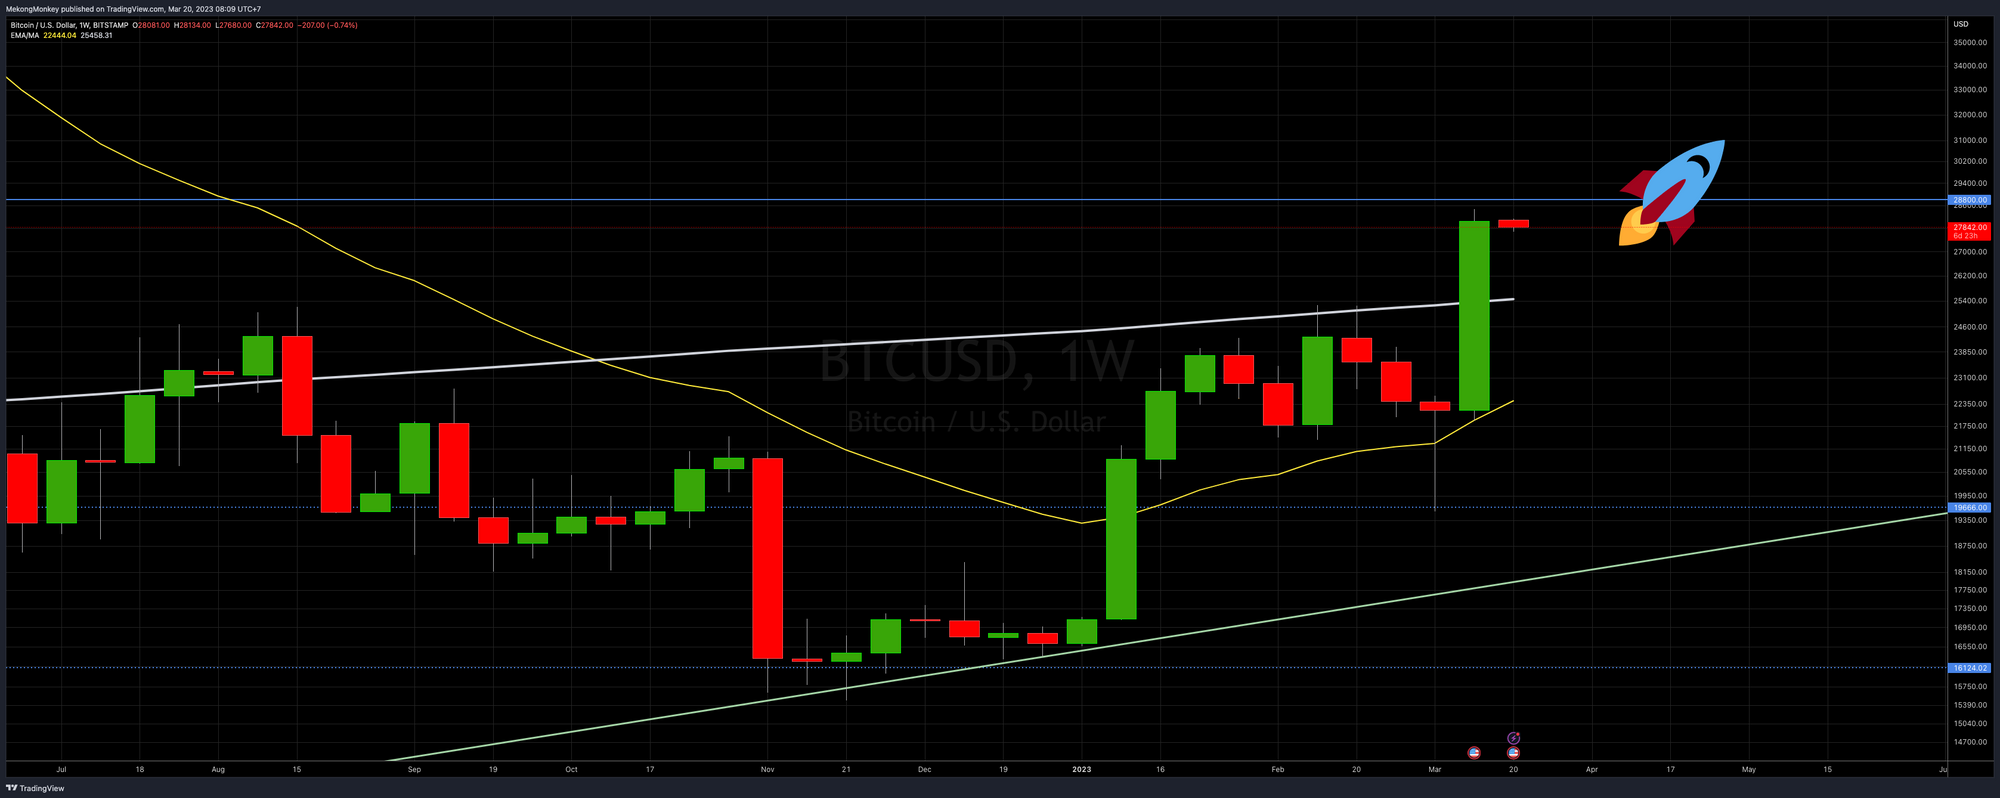
BTCUSD has traded between the 21 EMA (yellow) and the 200 SMA (white) since early January. After a failed bearish attempt to break the bottom of the range, bitcoin finally smashed through the 200-week SMA with a solid green candle. The bulls are in complete control now.
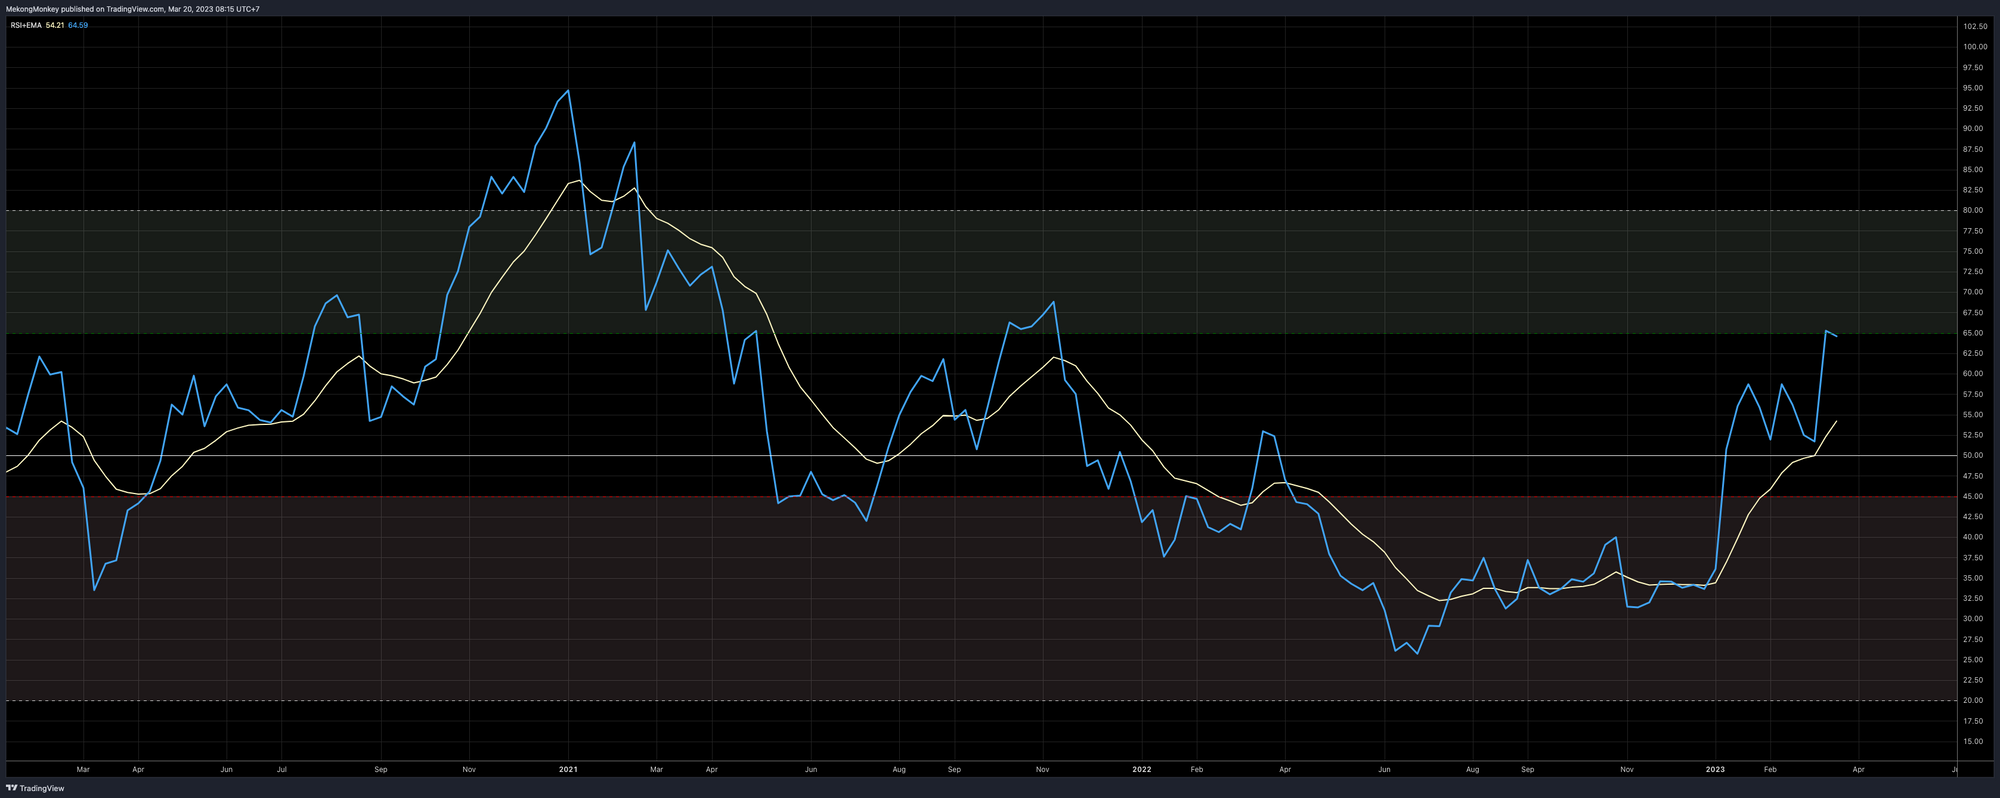
The Relative Strength Index (RSI) tapped the Bullish Control Area (the green zone) on a strong upward move, aligning momentum with price action nicely.
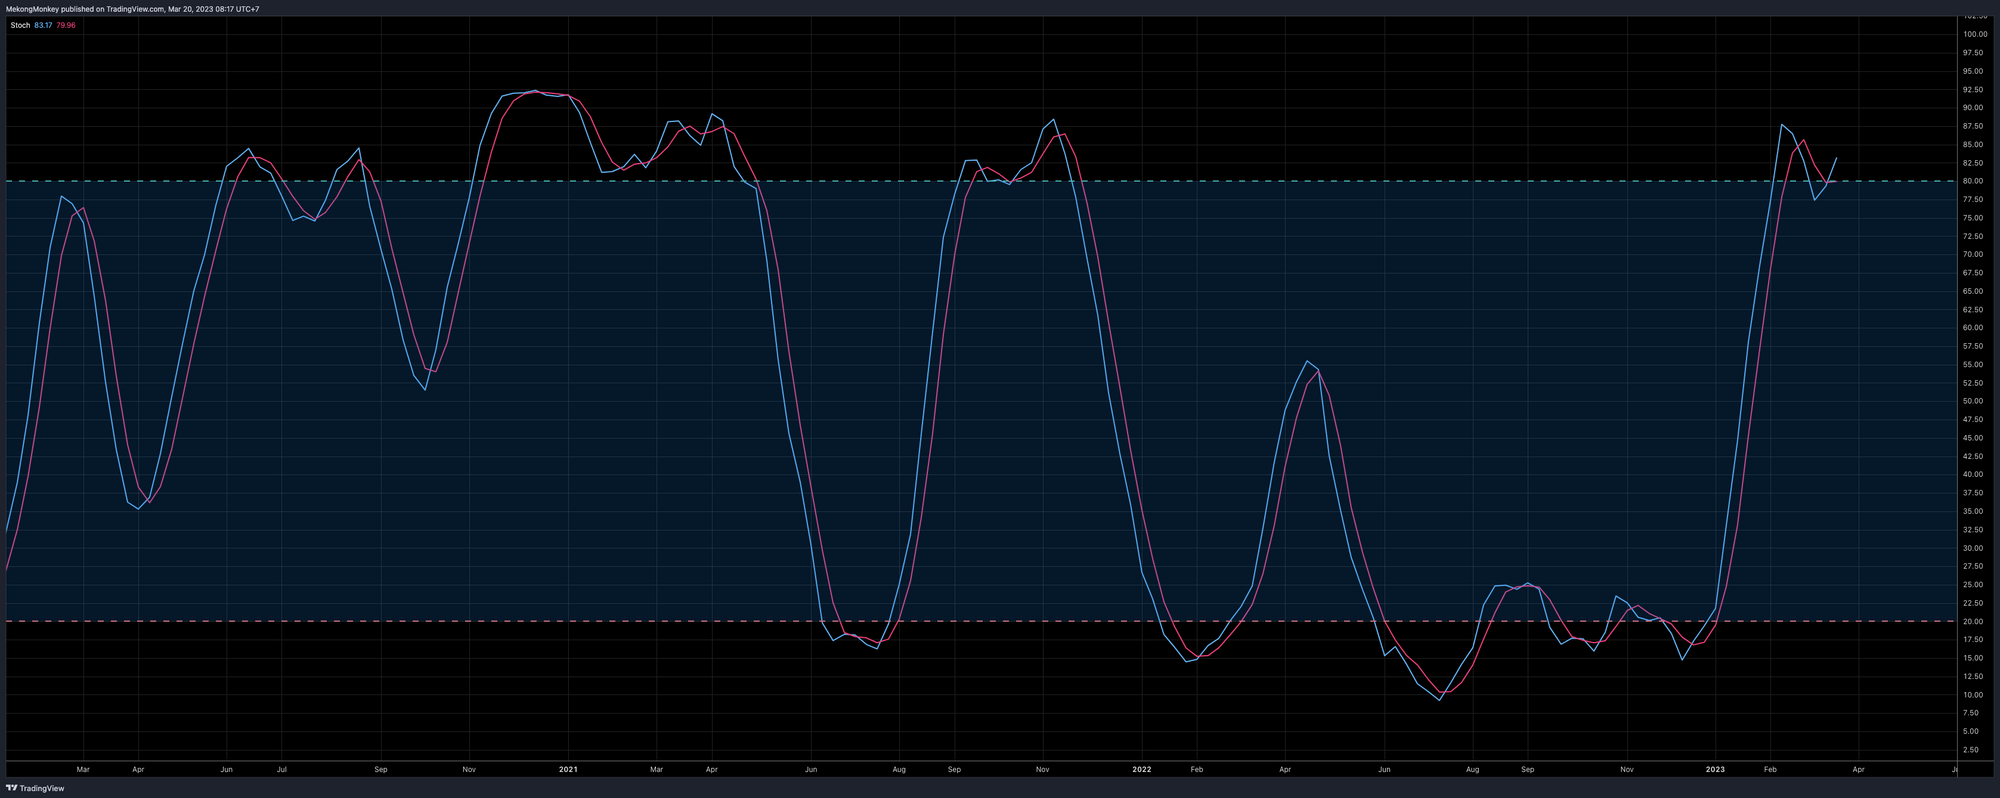
The Stochastic Oscillator (Stoch) has turned back up again. It's in the overbought territory (a reading above 80), but that's to be expected when the momentum moves powerfully to the bullish side. We believe it will stay elevated for the weeks to come. Only when the Stoch turns back down and drops below 80 might it indicate that the bull run is ending. But we are nowhere near that point yet. This is most likely just the very beginning.
🔮 To bring it all together:
The best time to buy bitcoin was in the last six months when BTCUSD traded below the 200-week Simple Moving Average. The second best time is now.
The only overhead Resistance that remains is the $28.8K HSR level. It's hard to predict how long it will take before it breaks, but now that bitcoin's back above the 200 SMA, we can be reasonably confident that this level will get broken sometime in the next few days to weeks. Once that goes, we'll probably have to start looking at $50K and beyond. The future is looking very bright and very orange. Nevertheless, let's try to remember to stay humble and keep stacking sats. 🚀🚀🚀
Bitcoin fixes this
Fiat is monopoly money. pic.twitter.com/SVHstXk6Zl
— Bitcoin Magazine (@BitcoinMagazine) March 14, 2023
Have a wonderful week, dear friends; take good care of yourself and your loved ones. You can reach us on Twitter, Telegram, or by e-mail with comments, questions, or suggestions.
Nostr pub key: npub1v5jycyudhv64tm4q66vjeqcvxrpgk6u507xypt44cc55ghyh7mqq42suxz
Greetings from Phnom Penh, and talk again soon!
Support The Weekly Close by using these excellent services:
- HodlHodl: buy and sell bitcoin peer-to-peer without counterparty risk.
- Rollbit: up to 1000X bitcoin leverage futures. Instant execution. 0% Slippage. 0% Fees on loss.
- Satsback: earn sats when shopping online.
We appreciate your support! ⚡MekongMonkey@stacker.news
Not trading advice. You are solely responsible for your actions and decisions.