
The Weekly Close #9: Bitcoin 2023 price predictions
We expect a green candle for 2023 with a price increase between +30% ($22K) and +300% ($66K).

Dear friends,
We hope you enjoyed the holidays and wish you a wonderful new year. Let’s look at some bitcoin charts.
The weekly chart: bitcoin’s sitting on a ledge
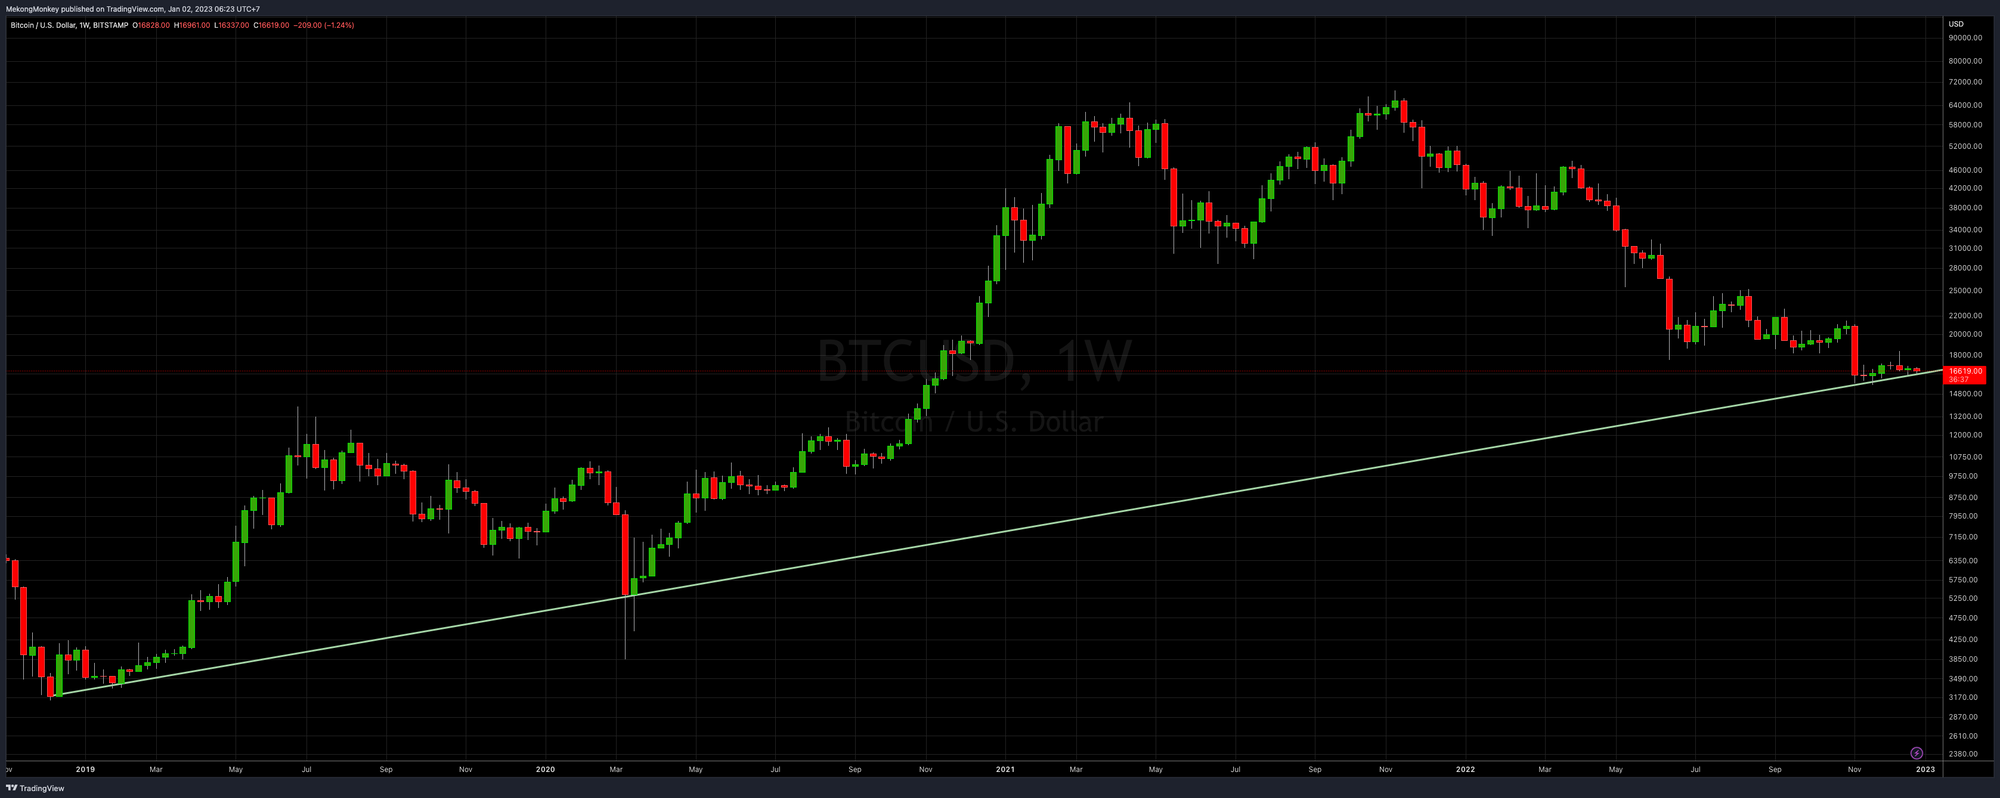
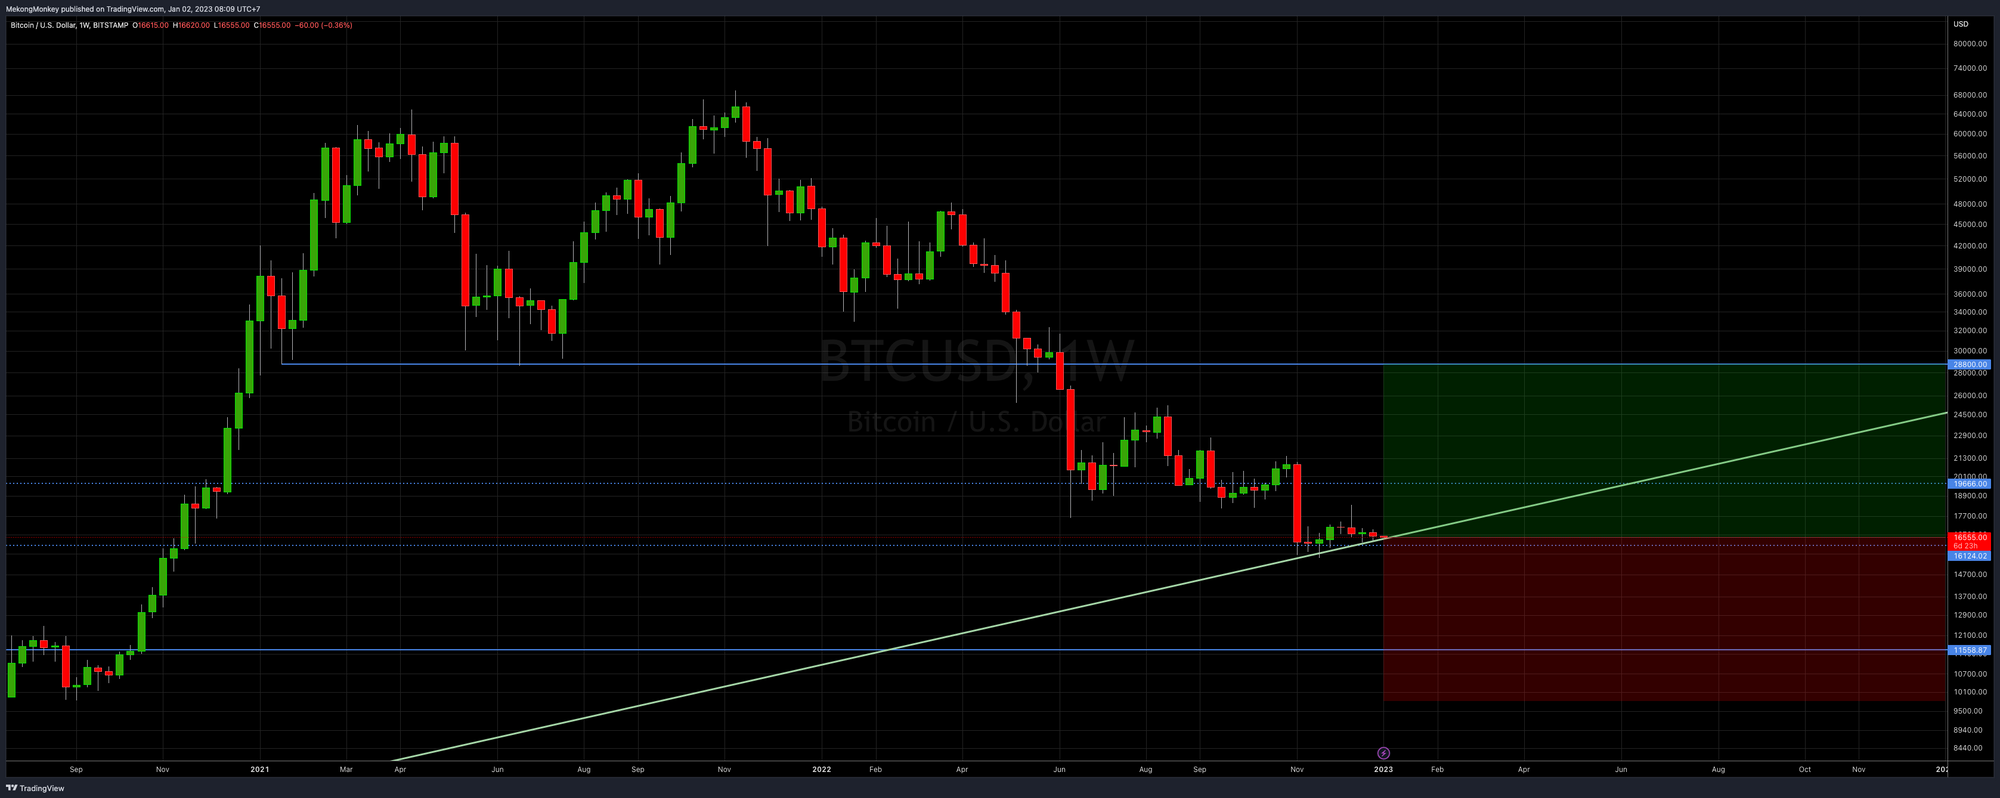
Nothing has changed during the holidays. BTCUSD is still grinding, ever so slightly, upwards along the bullish trend line (green diagonal). It would be nice if we could get a little lift off, up and away from the trend line. However, sitting on a ledge is fine. It’s only falling off that is problematic. So far, there are no signs of tumbling down. The most likely part forward remains up to $20K.
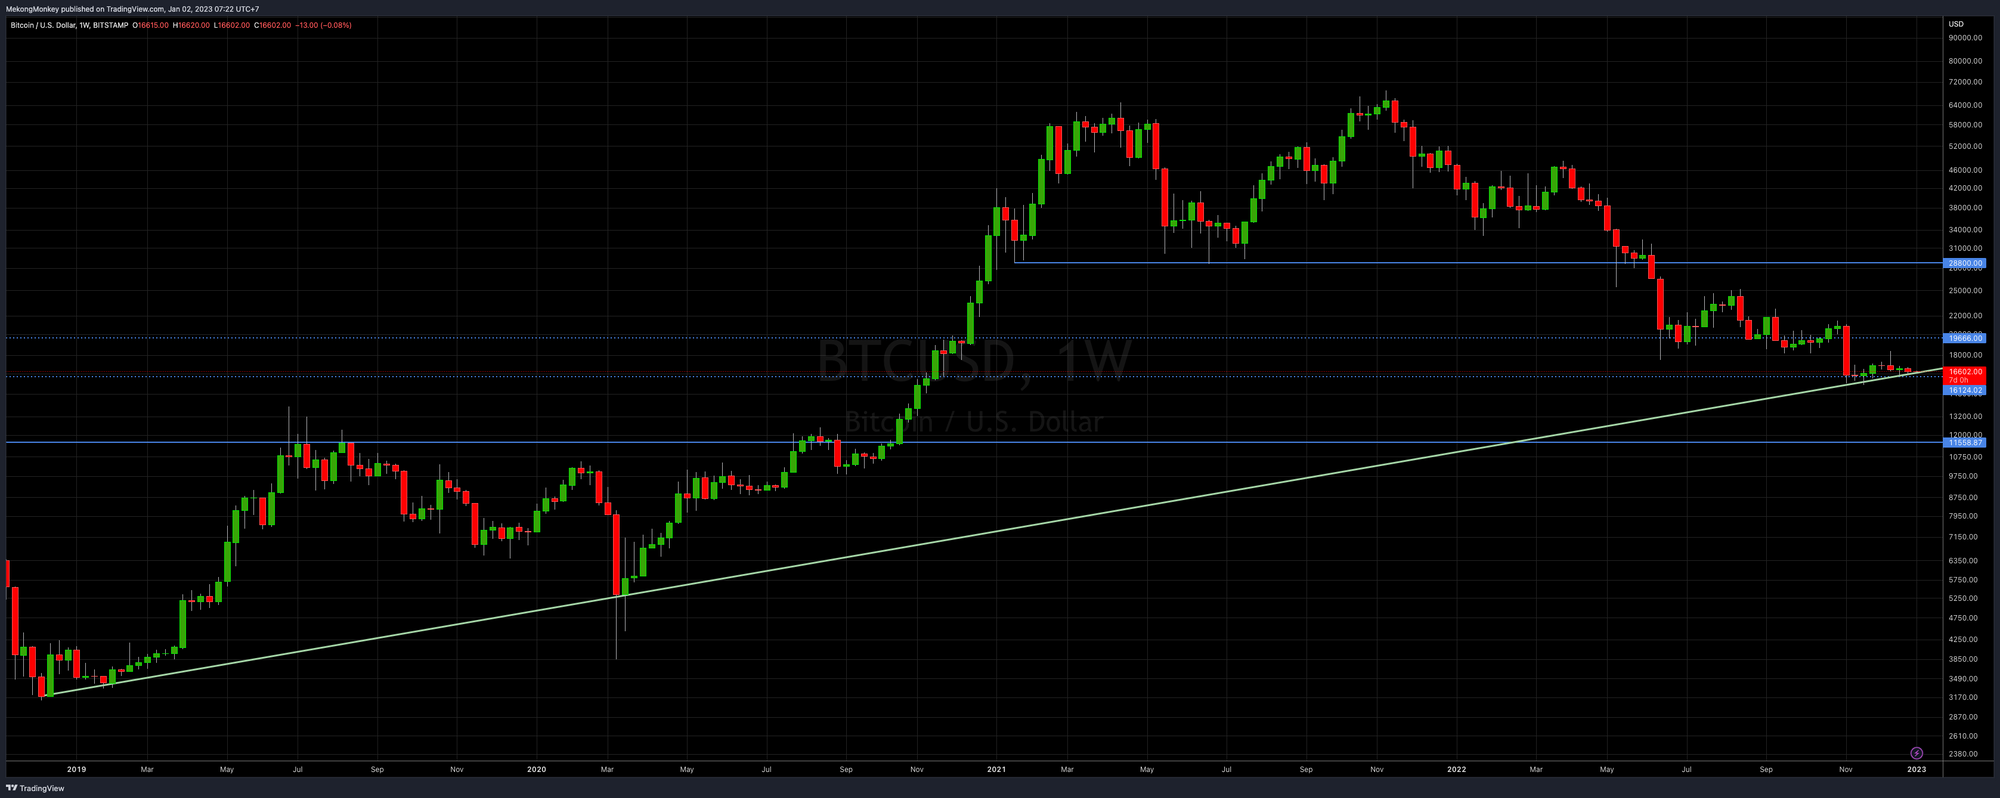
We’ve added two more Horizontal Support and Resistance levels: around $12K (blue), which has acted as heavy Resistance during the 2018-2019 bear market, and $28K (blue), which provided Support during the 2021 bull run. Currently, bitcoin is still trading between $16K and $20K. This range acts as a mid-point Support/Resistance area in the more extensive $12K-$28K range.
So bitcoin is trading near the bottom of the mid-point Support area, above the bullish trend line. Moving to the top mid-point range, around $20K, remains the most likely short-term path forward.
New Year’s Special: the 4-year cycle
The reward bitcoin miners receive for including transactions into a block is not constant. After every 210000 blocks mined, the block reward halves. This event occurs about once every four years.
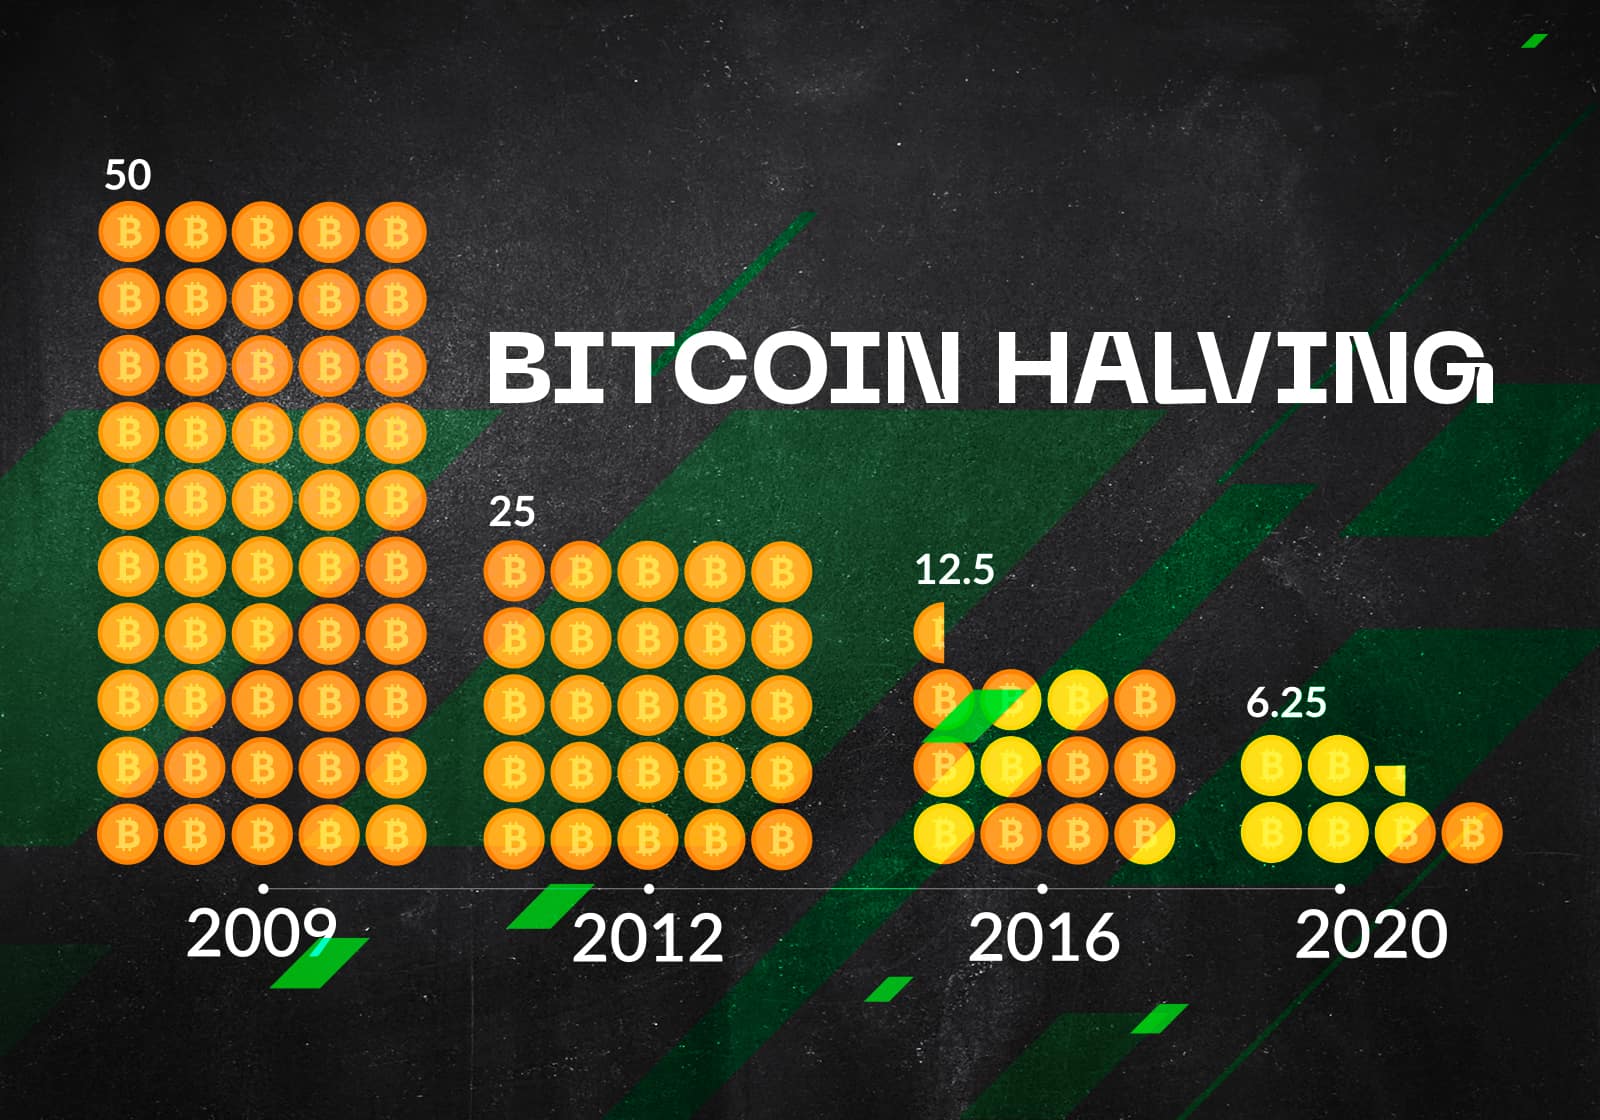
The reduced supply affects the price and creates a 4-year cycle. The sample data is limited because the first halving occurred only ten years ago. However, if we put the 4-year cycle on a yearly BTCUSD price chart, it looks like this (bear in mind that this is a logarithmic chart):
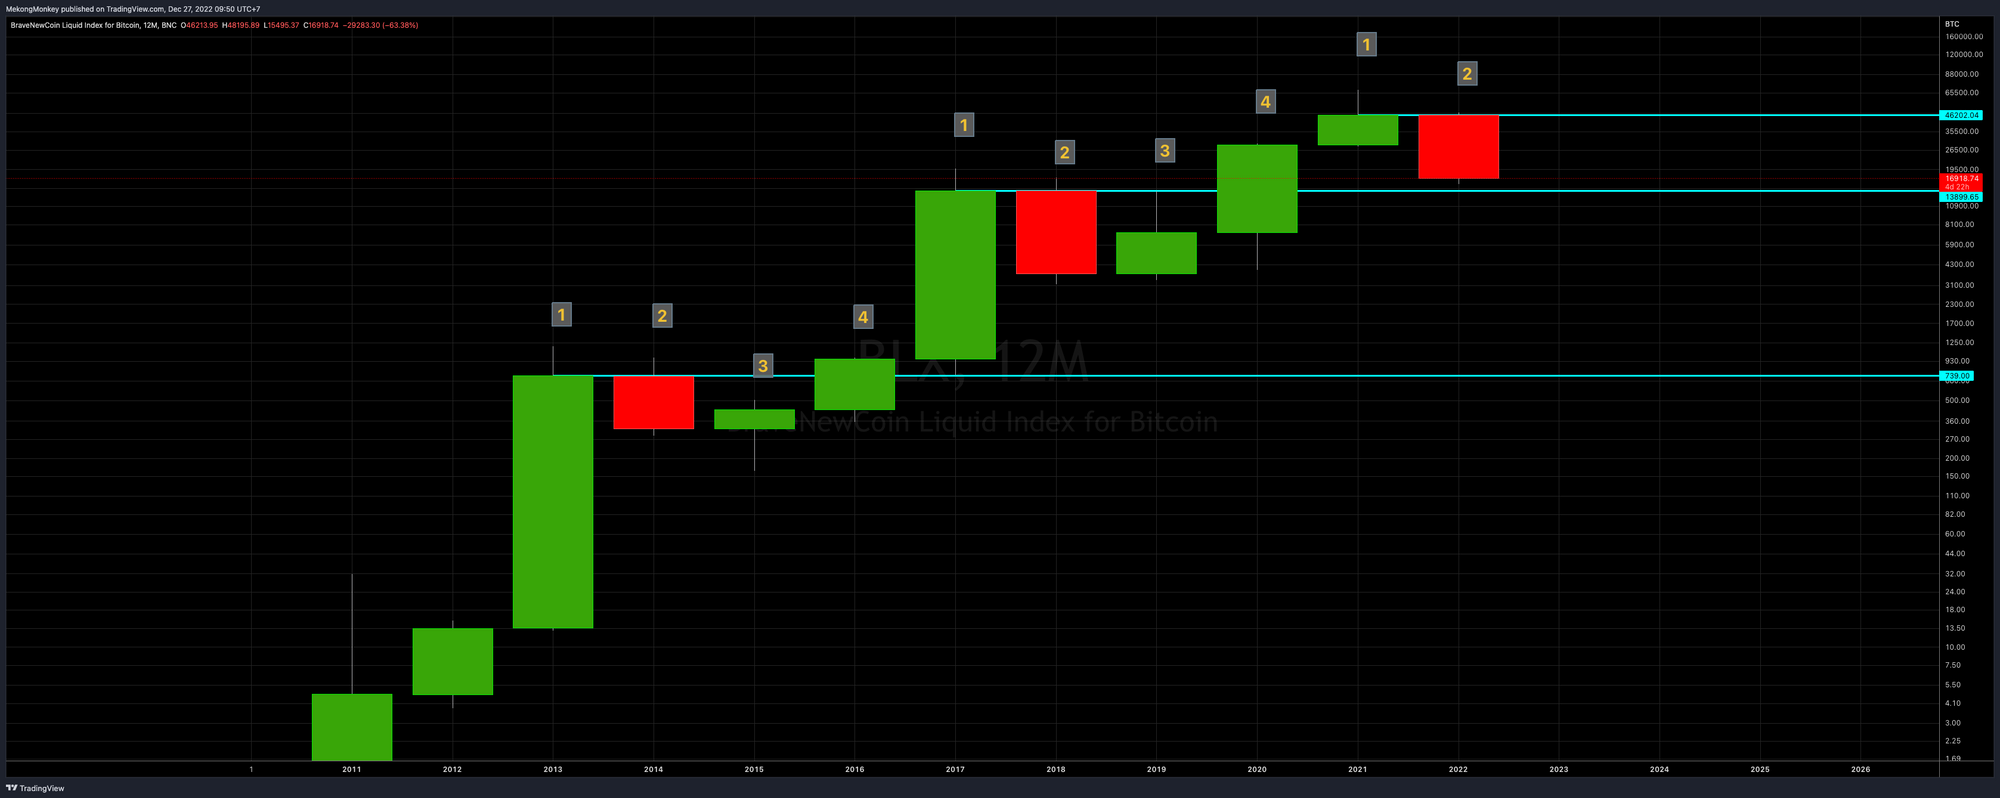
When we label the first year after the halving as Year 1, we get the 4-year cycle:
- Year 1 (2013, 2017, 2021): strong price appreciation resulting in a new all-time high.
- Year 2 (2014, 2018, 2022): pullback after the exuberance of the new high.
- Year 3 (2015, 2019): after the pullback of year 2, the price starts recovering in anticipation of a new halving coming up.
- Year 4 (2016, 2020): a new block reward halving takes place, which leads to price rallying to new highs.
According to this analysis, we are at the beginning of Year 3, meaning bitcoin has bottomed or is very near bottoming.
How did bitcoin fair in previous Year 3s?
- In 2015 price appreciated, from January to December, by 35%.
- In 2019 price, ignoring wicks, appreciated 92%.
- If we consider the yearly candle wicks, 2015 saw a +206% price increase from the bottom, and 2019 saw a +312% increase from wick to wick.
We can expect another green candle for 2023 with a price increase between +30% ($22K) and +300% ($66K).
To bring it all together:
BTCUSD has been consolidating above $16K Support for the last seven weeks while respecting the bullish trend line formed by the 2018 and 2020 bottoms. Our thesis that bitcoin has bottomed remains unchanged.
Suppose we are mistaken, and there’s another leg down due to another crypto exchange collapse or a similar event. In that case, $12K Support is the most likely place to go.
A test of $20K Resistance is the probable path forward for the short term.
If we combine our weekly chart analysis with the 4-year cycle, we can conclude:
- Bitcoin has bottomed or is very close to bottoming.
- $12K is the absolute floor. An unforeseen, catastrophic event could send us there, but chances are slim.
- We expect the closing price of BTCUSD for 2023 to be around $28K, roughly +69% from current prices.
An easy way to trade this thesis would be to buy bitcoin futures contracts now, take profit at the $28800 Resistance level, and put a Stop-Loss some distance under the $12K Support level (at around $10K in our example). This setup has a 1.82 Risk/Reward ratio and a potential profit of +74%:
Of course, the best strategy remains, as ever, to buy bitcoin and HODL without any intention of selling for years to come.
Inspirational Tweet before you go:
Most common response I’ve been hearing wrt to #Bitcoin is that people feel they “missed it.” This couldn’t be further from the truth pic.twitter.com/8qXItp8tI0
— Alan ₿ Watts ⚡️ (@alanbwt) December 25, 2022
Have a wonderful week and a fabulous 2023, dear friends; take good care of yourself and your loved ones. You can reach us on Twitter, Telegram, or by e-mail, if you have any comments, questions, or suggestions.
Greetings from Phnom Penh, and talk again soon!

Not trading advice. You are solely responsible for your actions and decisions.