
The Weekly Close #17: Waiting for action
Bitcoin is still stuck below the 200-week Moving Average.
Dear friends,
A short and quick edition of The Weekly Close this time.
📉 The weekly bitcoin chart
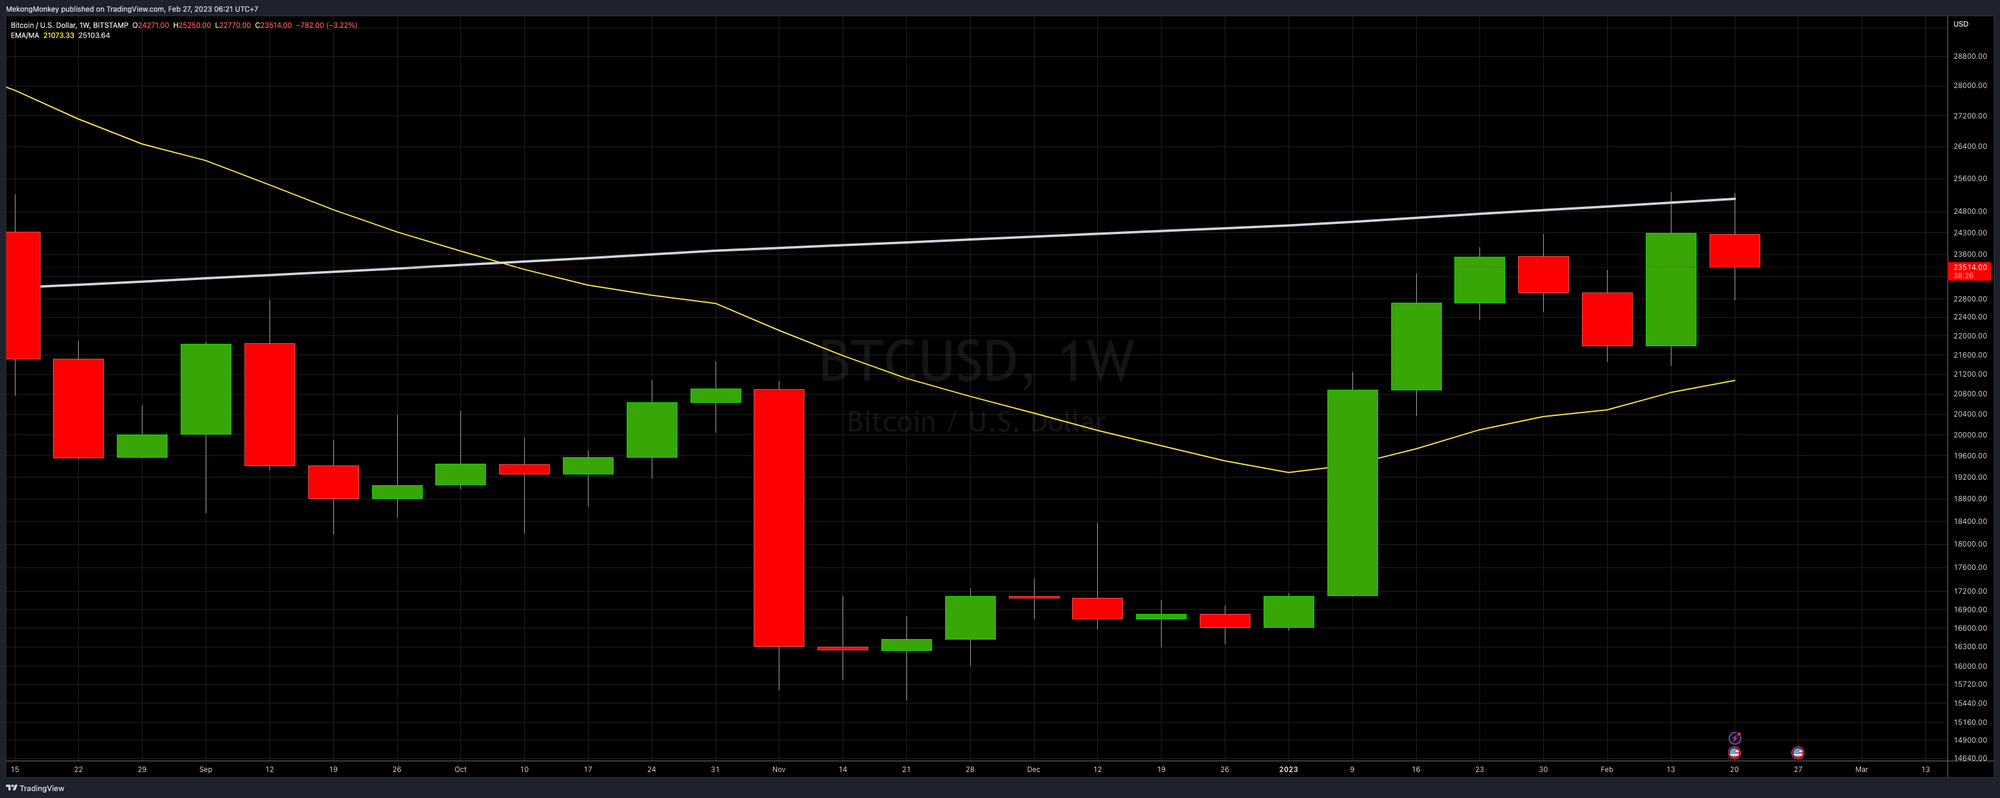
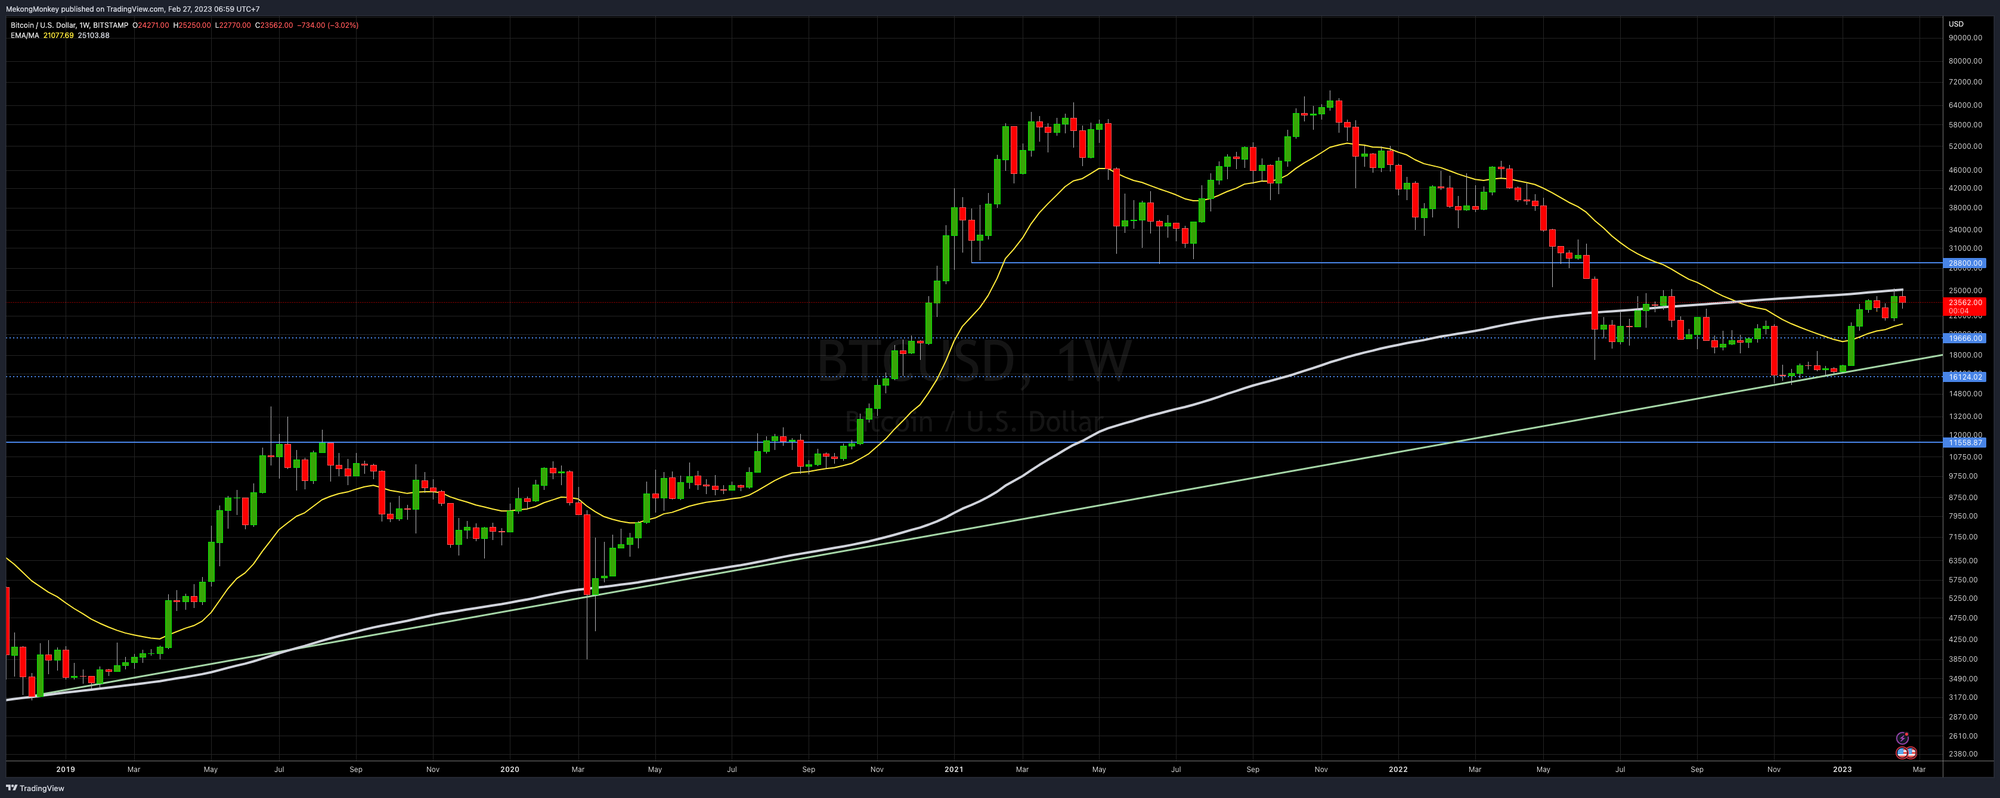
BTCUSD is stuck between the 200-week Simple Moving Average (SMA, in white) and the 21-week Exponential Moving Average (EMA, in yellow). Bitcoin tested the 200 SMA again but failed to hold on and closed in the red. However, the dip is, once again, minor.
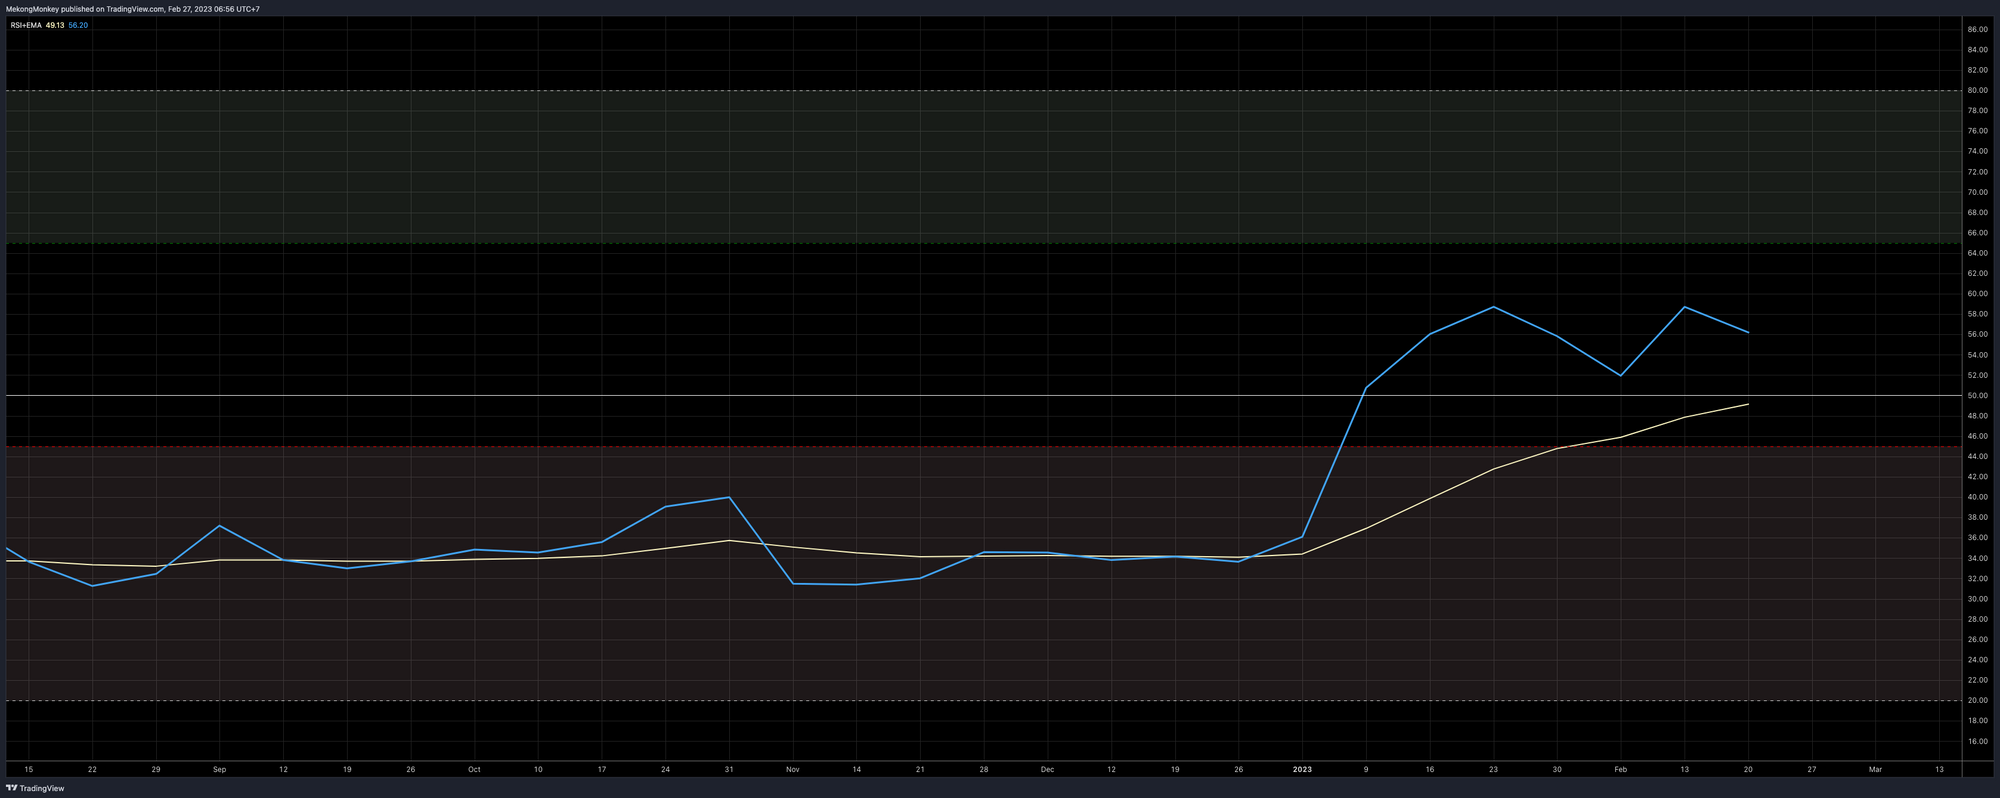
The momentum hasn’t changed since last week. The Relative Strength Index (RSI) is in the Neutral Zone, above the midpoint (white horizontal), and has much room to move higher.
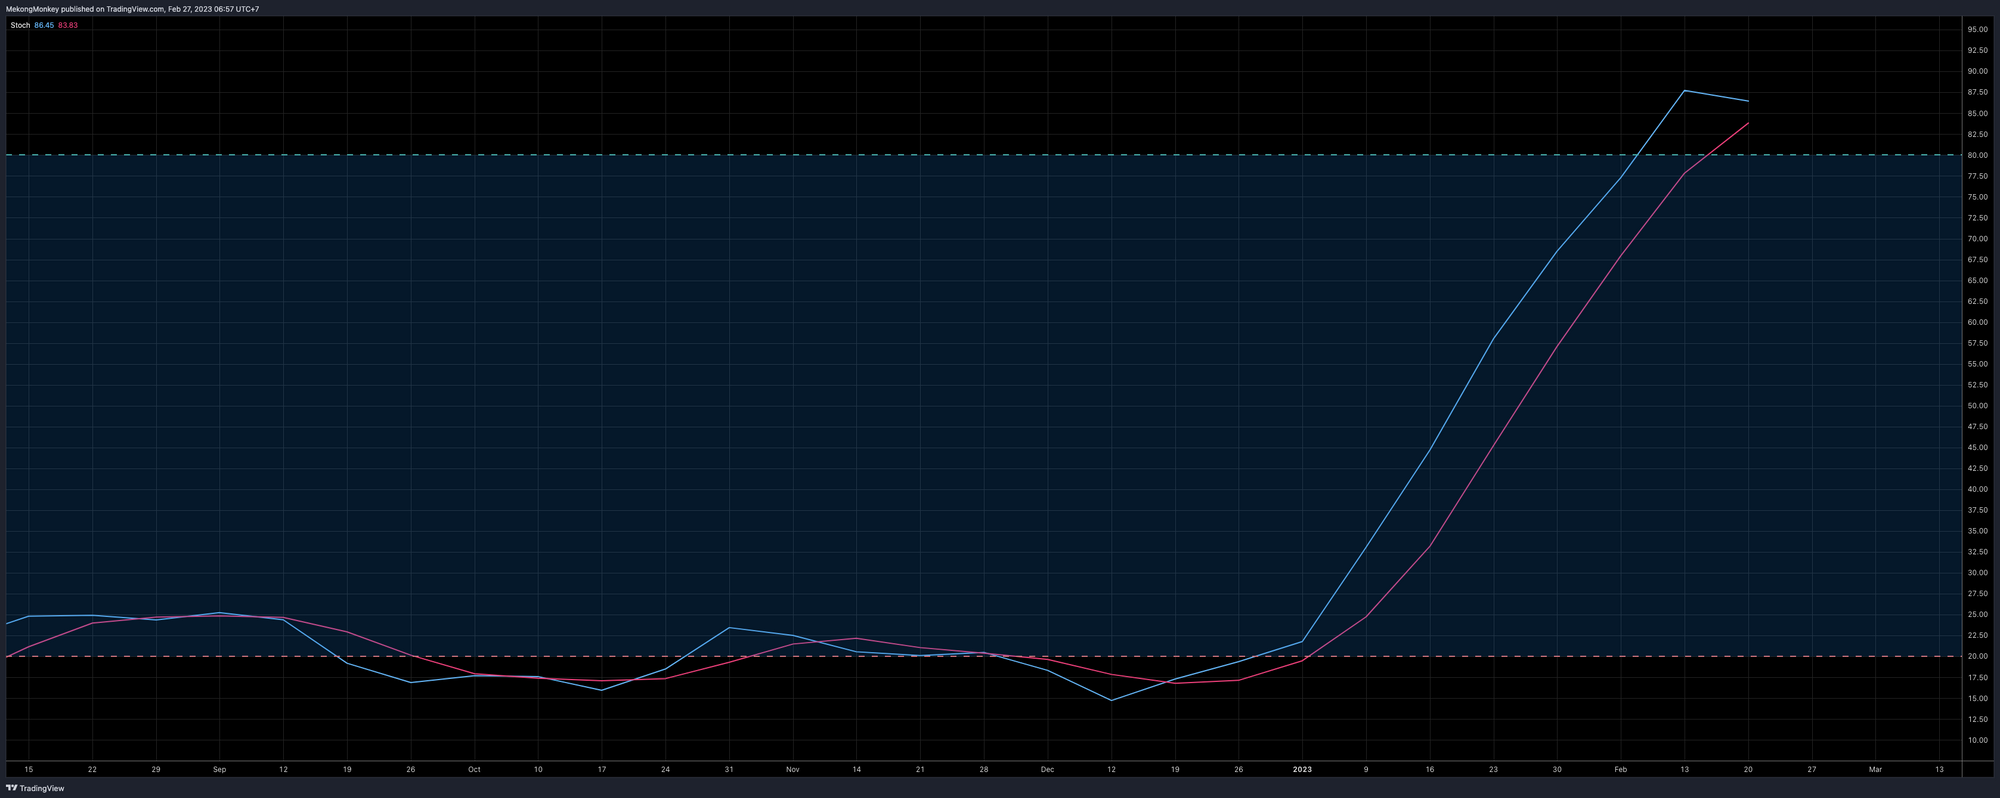
The Stochastic Oscillator still suggests overbought conditions (a reading above 80), which possibly means more sideways to downward price action soon.
🔮 To bring it all together:
Strong opposing forces are working on the bitcoin price:
- After breaking through the 21 EMA in early January, bitcoin has approached but failed to break the 200 SMA. This Moving Average is acting as clean Resistance. A test of Resistance without breaking it is bearish and will likely push the price lower. So, we have to look at lower targets. The 21 EMA, around $21.3K, is the first area of Support, with Horizontal Support right below it at around $20K and the bullish trend line, around $17.6K, as the ultimate line in the sand for the bulls to hold.
- On the other hand, the weekly 200 SMA is the most critical Resistance level on the chart right now. Bitcoin sustaining itself nearby this level without heavy rejection means there’s not much selling. At any moment, the price could explode upwards to the primary Horizontal Resistance level of around $28.8K.
This makes the current situation a tricky spot. If bitcoin gets ultimately rejected here, we will probably look at weeks to months of down-to-sideways price action. However, if the 200 SMA breaks, bitcoin will move higher fast.
It is either time to gamble or, probably the best approach, wait and see how this plays out in the week ahead.
In case of doubt, HODL on
HODL #Bitcoin ✊ pic.twitter.com/HFlwhtB5o5
— Bitcoin Magazine (@BitcoinMagazine) February 20, 2023
Have a wonderful week, dear friends; take good care of yourself and your loved ones. You can reach us on Twitter, Telegram, or e-mail with any comments, questions, or suggestions.
Nostr pub key: npub1v5jycyudhv64tm4q66vjeqcvxrpgk6u507xypt44cc55ghyh7mqq42suxz
Greetings from Phnom Penh, and talk again soon!

Support The Weekly Close by using these excellent services:
- HodlHodl: buy and sell bitcoin peer-to-peer without counterparty risk.
- Rollbit: up to 1000X bitcoin leverage futures. Instant execution. 0% Slippage. 0% Fees on loss.
- Satsback: earn sats when shopping online.
We appreciate your support! ⚡MekongMonkey@stacker.news
Not trading advice. You are solely responsible for your actions and decisions.