
The Weekly Close #18: Waiting for action, part 2
The bitcoin price is still playing the waiting game.

Dear friends,
Welcome to the latest edition of The Weekly Close!
Spoiler alert: nothing has changed since issue #17, and last week's conclusion remains valid.
It is either time to gamble or, probably the best approach, wait and see how this plays out in the week ahead. — The Weekly Close #17
Nevertheless, here's a quick overview of the weekly bitcoin chart:
📉 The weekly bitcoin chart
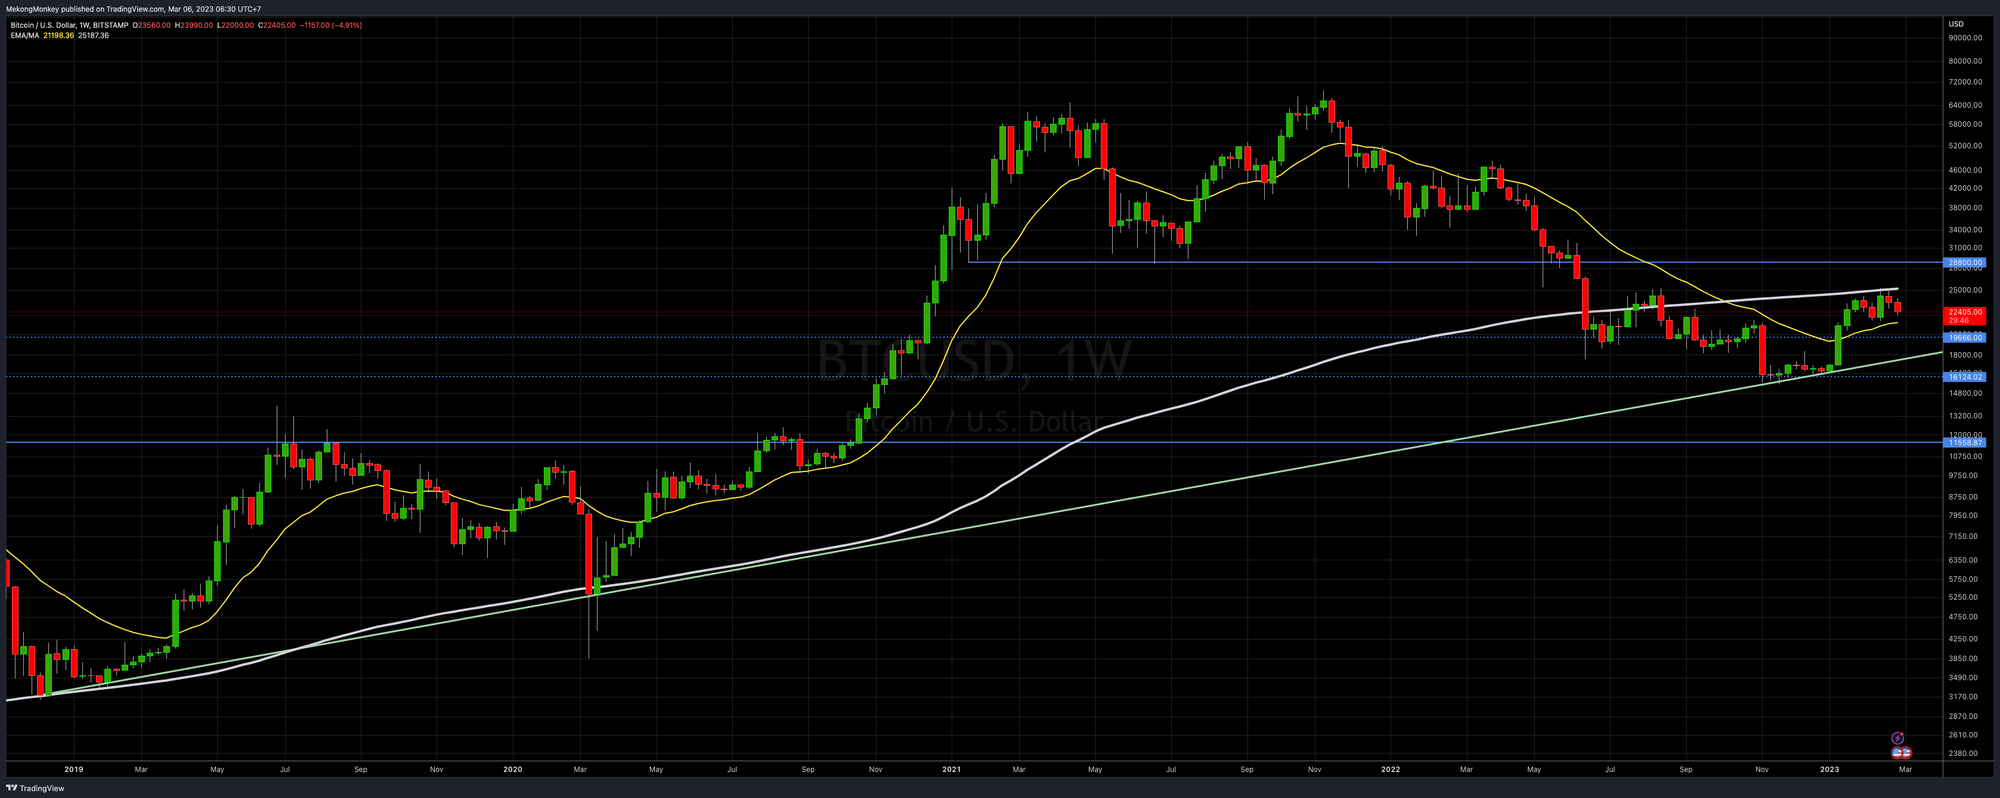
The bitcoin price remains where we left it last week, consolidating between the 21-week Exponential Moving Average (EMA, in yellow) and the 200-week Simple Moving Average (SMA, in white). The nearest Horizontal Support level is around $20K (dotted blue horizontal), while overhead Horizontal Resistance sits around $28.8K (blue horizontal).
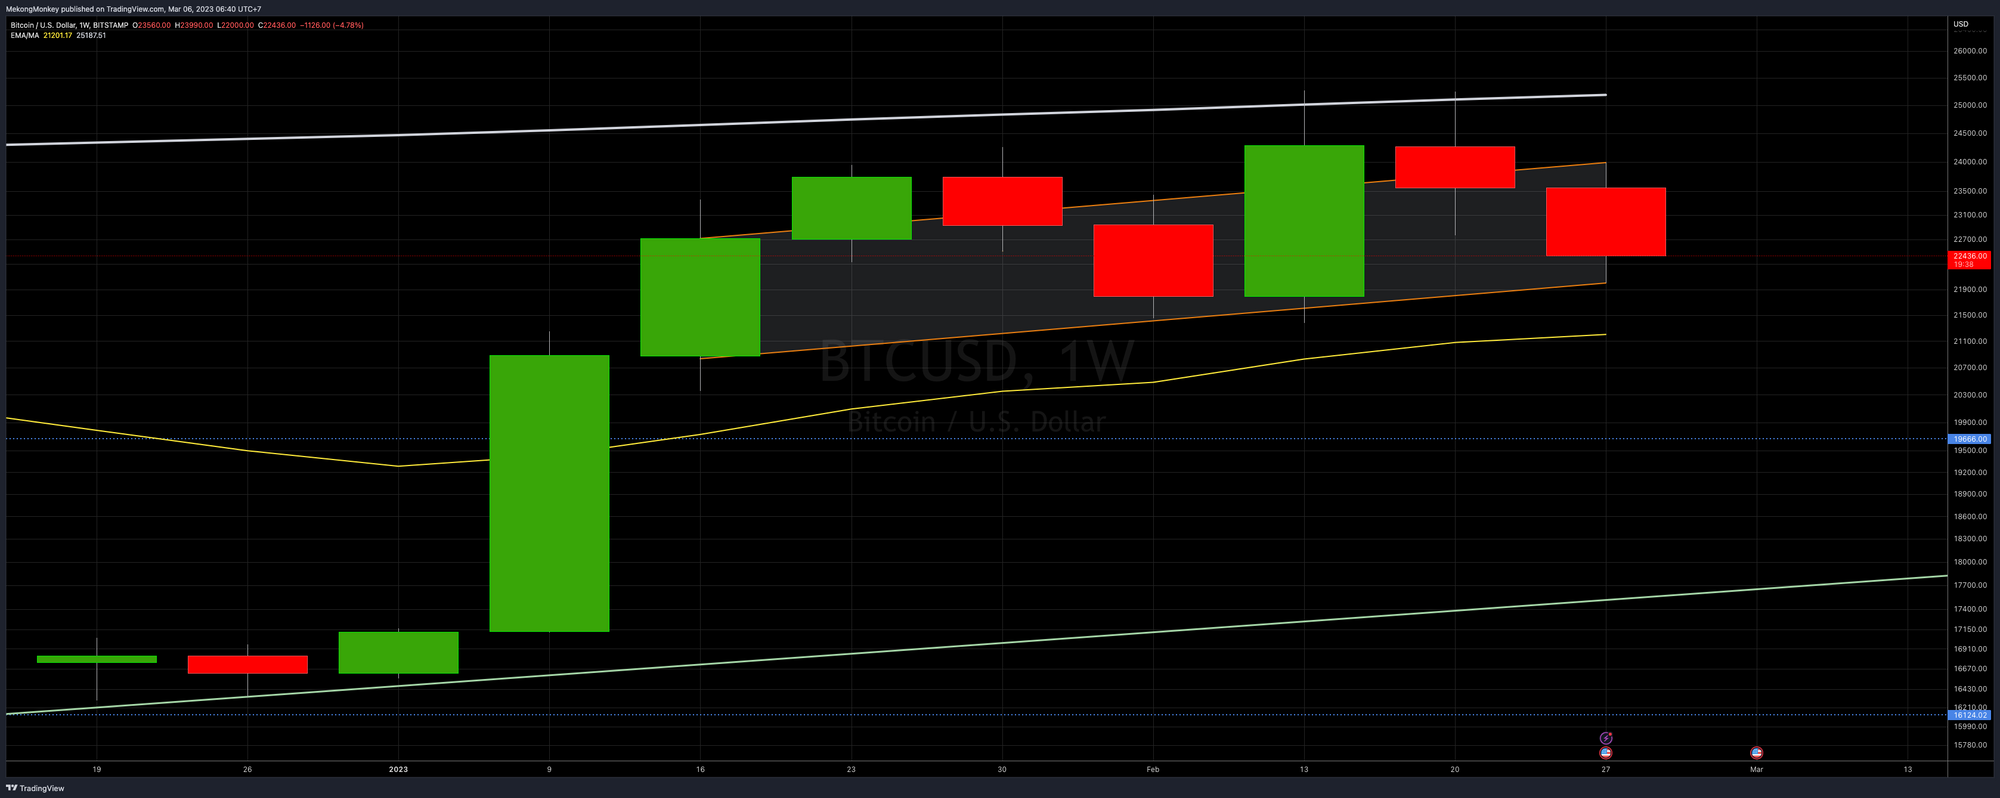
When we look closer, we see that bitcoin printed another red candle. However, the trend is still up. BTCUSD has consistently been making higher highs and higher lows since closing above the 21 EMA in early January.
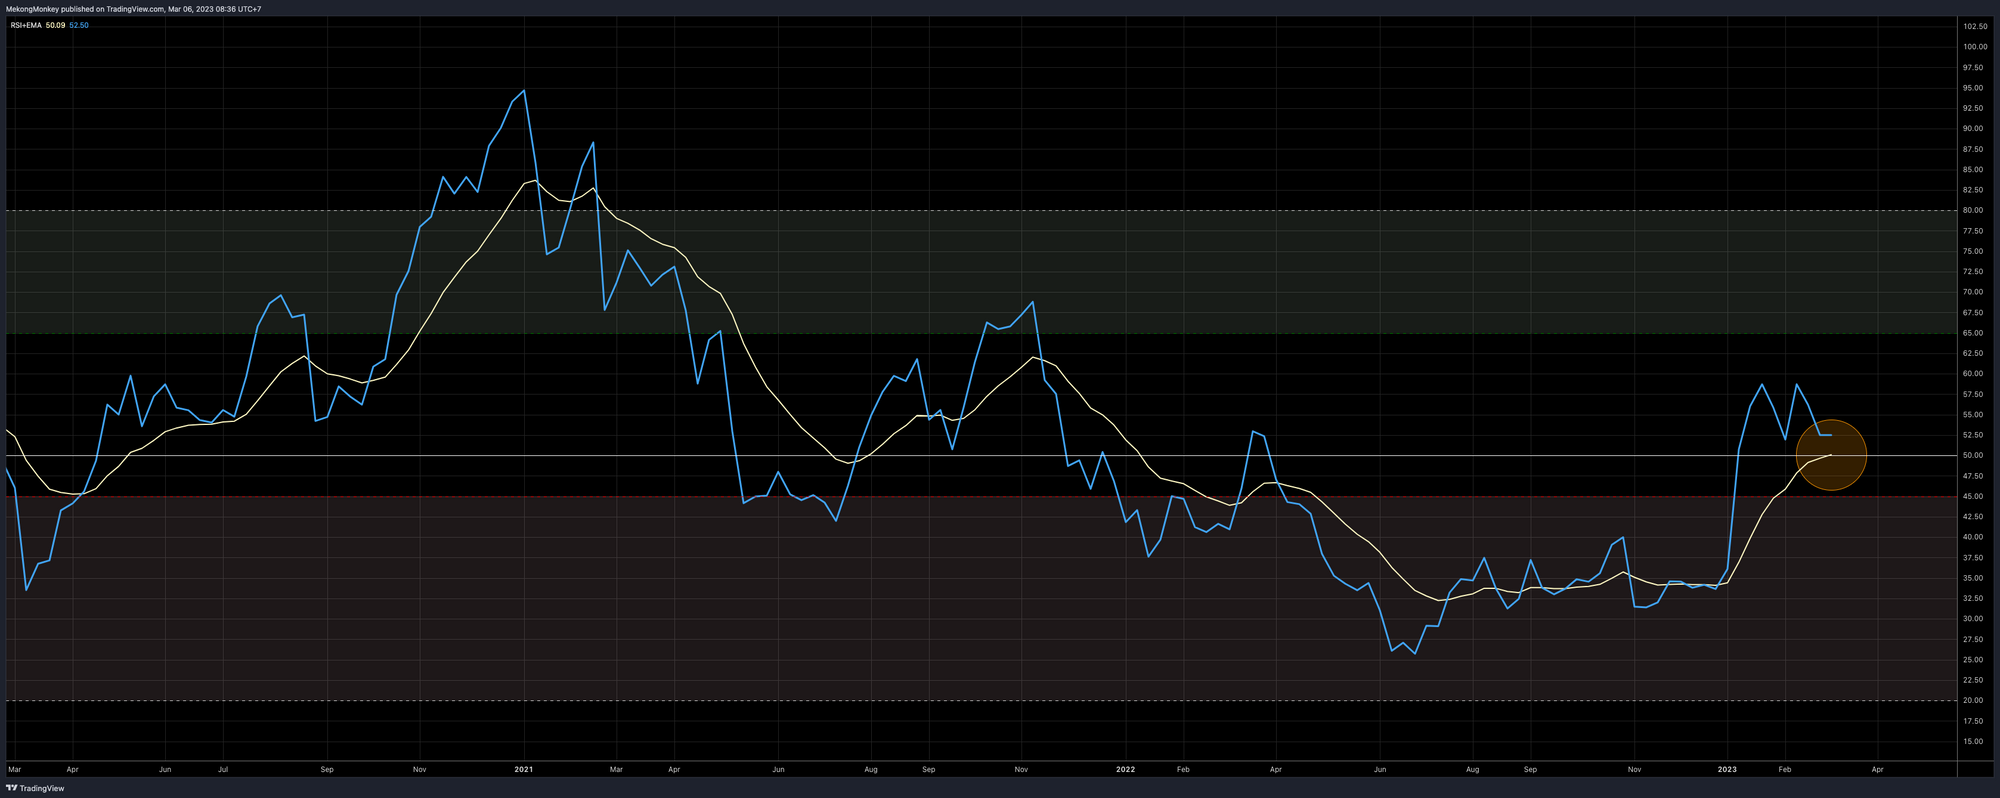
The Relative Strength Index (RSI) is also more or less where we left it last week. However, the EMA of the RSI has crossed over the midpoint (the yellow line crossed the white horizontal) for the first time since losing the center in early 2022.
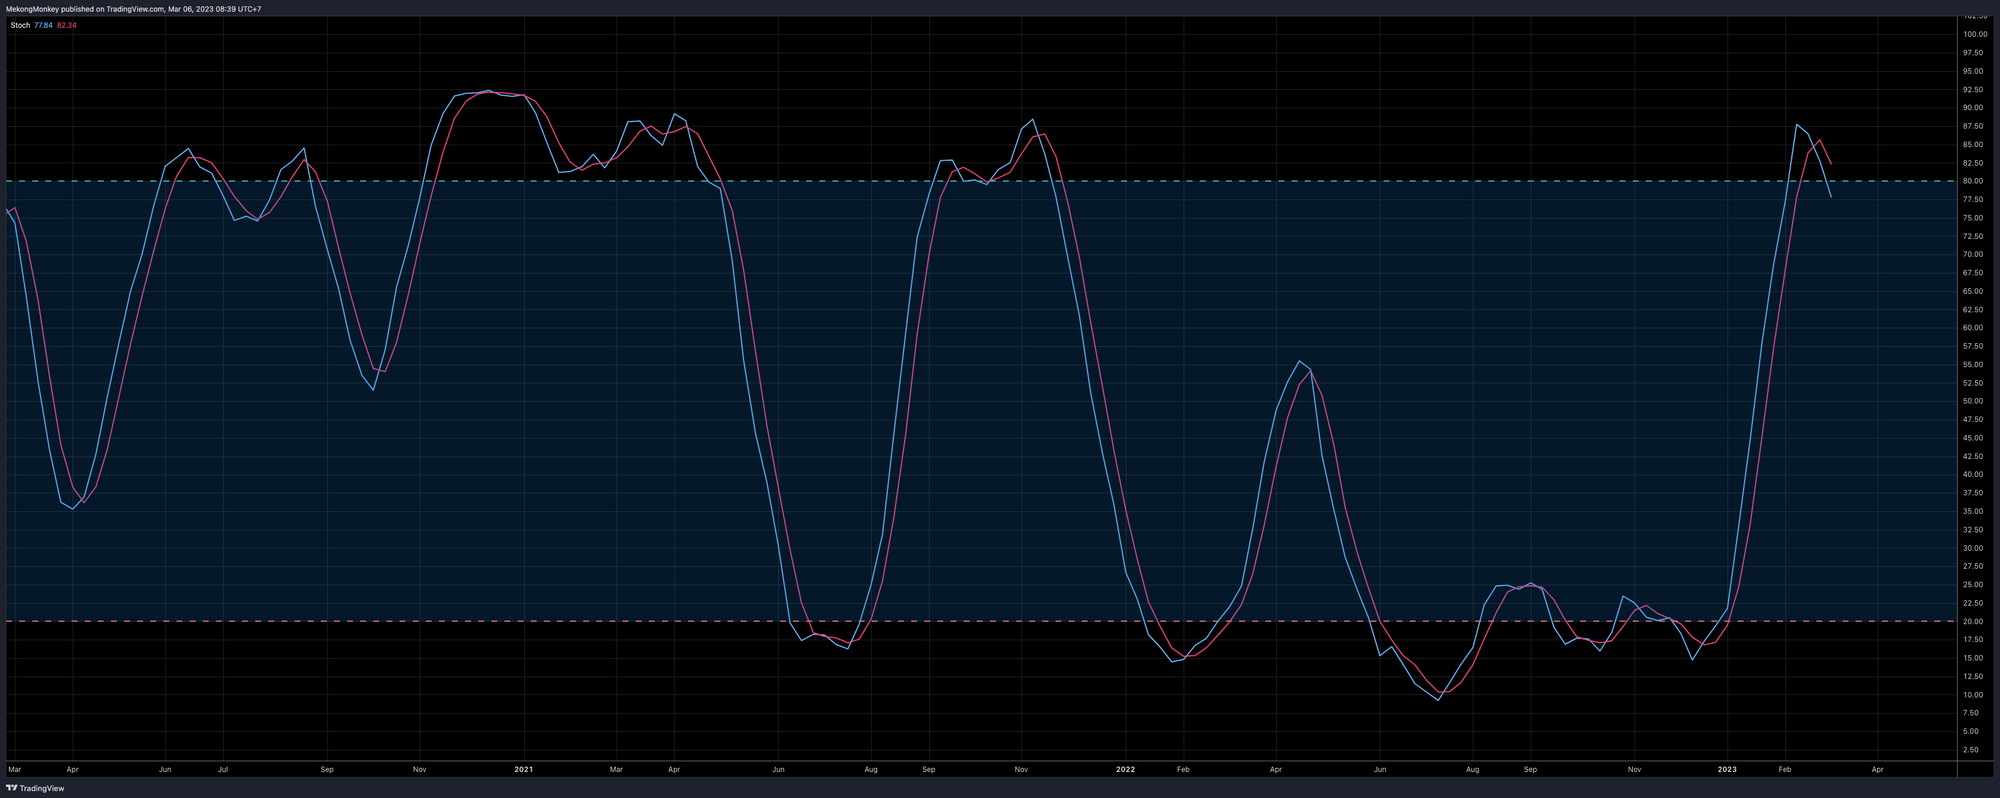
The Stochastic Oscillator paints the opposite picture of the RSI; it's dropping out of the overbought territory and firmly pointing down.
There is no clear trend when the RSI and Stoch give opposite signals. Patience is advised in times like these.
🔮 To bring it all together:
BTCUSD is still playing the waiting game. The more time spent in a tight range, the more violent the next move will be. Either the price breaks through the 200-week SMA, and we'll be at $30K in no time, or bitcoin breaks down through the 21-week EMA, and we'll be back at $20K or lower.
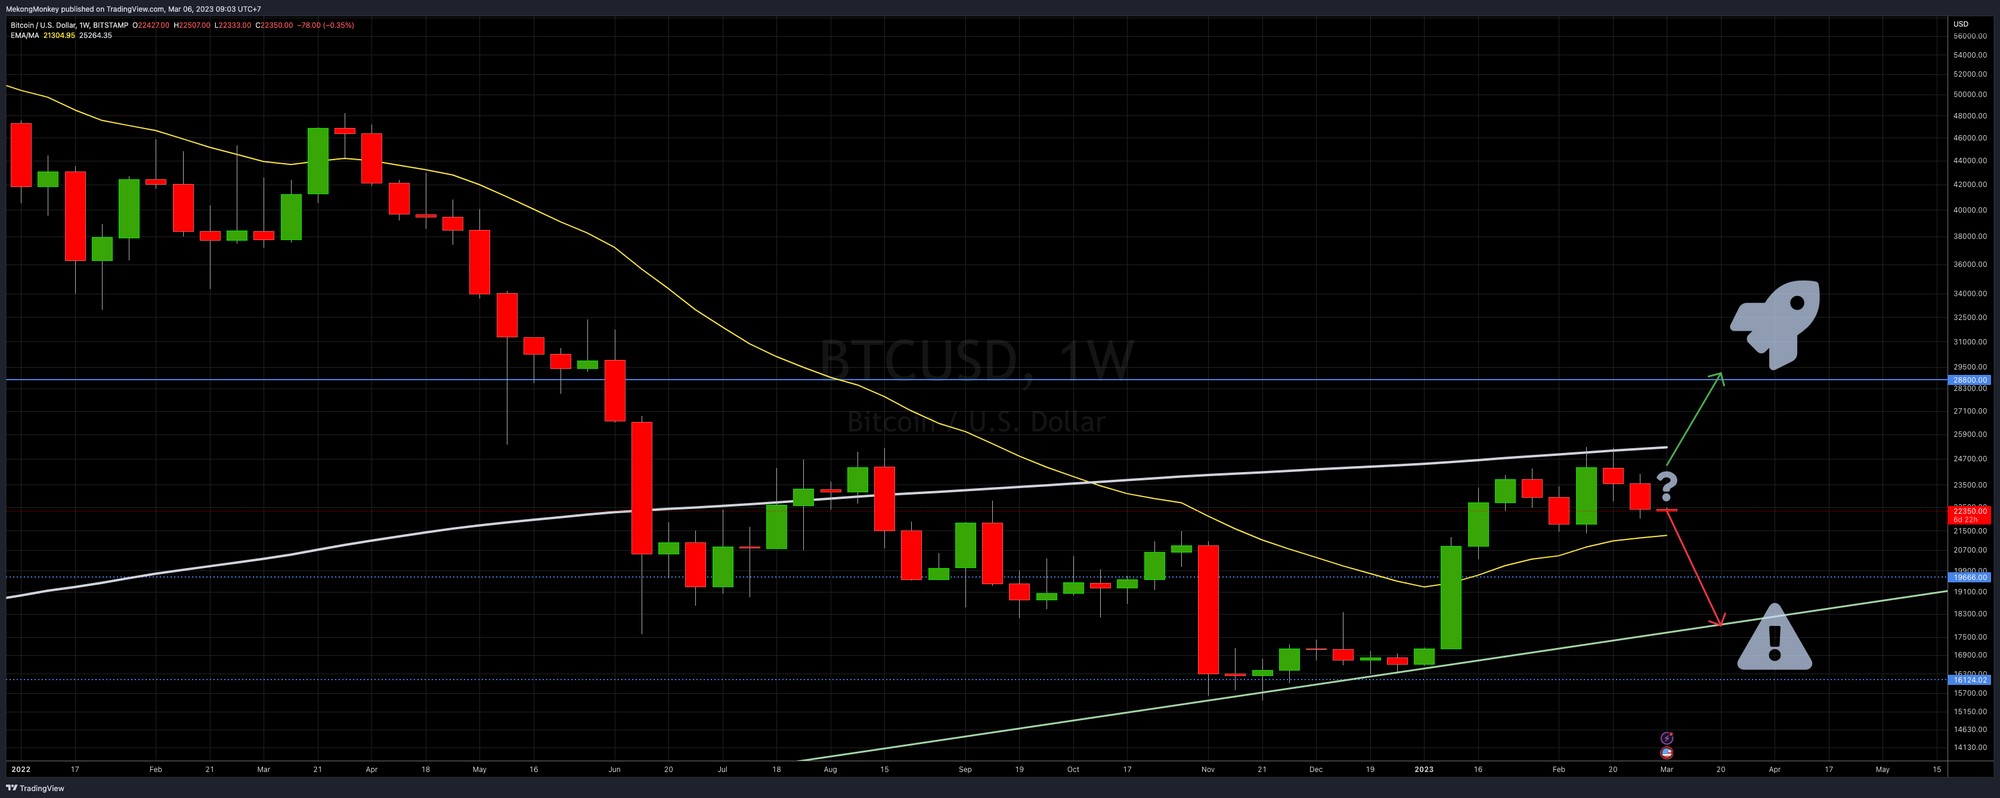
The bullish trend line currently sits just below $18K. That level needs to hold to keep bullish hopes and dreams alive.
Have a wonderful week, dear friends; take good care of yourself and your loved ones. You can reach us on Twitter, Telegram, or e-mail with any comments, questions, or suggestions.
Nostr pub key: npub1v5jycyudhv64tm4q66vjeqcvxrpgk6u507xypt44cc55ghyh7mqq42suxz
Greetings from Phnom Penh, and talk again soon!

Support The Weekly Close by using these excellent services:
- HodlHodl: buy and sell bitcoin peer-to-peer without counterparty risk.
- Rollbit: up to 1000X bitcoin leverage futures. Instant execution. 0% Slippage. 0% Fees on loss.
- Satsback: earn sats when shopping online.
We appreciate your support! ⚡MekongMonkey@stacker.news
Not trading advice. You are solely responsible for your actions and decisions.