
The Weekly Close #2: Green and Steady
BTCUSD: three green weekly candles in a row and bullish momentum rising.

Dear friends,
You’re receiving this bitcoin research and market analysis newsletter because, a long time ago, you signed up for the MekongMonkey newsletter on our website. Now that we’re in the late stages of the current bear market, we’re starting this new weekly newsletter in which we’ll track the progress of bitcoin toward $200K. If you’d like to come along for the ride, you have to do nothing if you’re reading this in your mailbox. On the other hand, if you don’t care about colossal gains and the hardest money the world has ever seen, scroll down and hit the unsubscribe button.
With all that out of the way, let’s have a look at the latest weekly close:
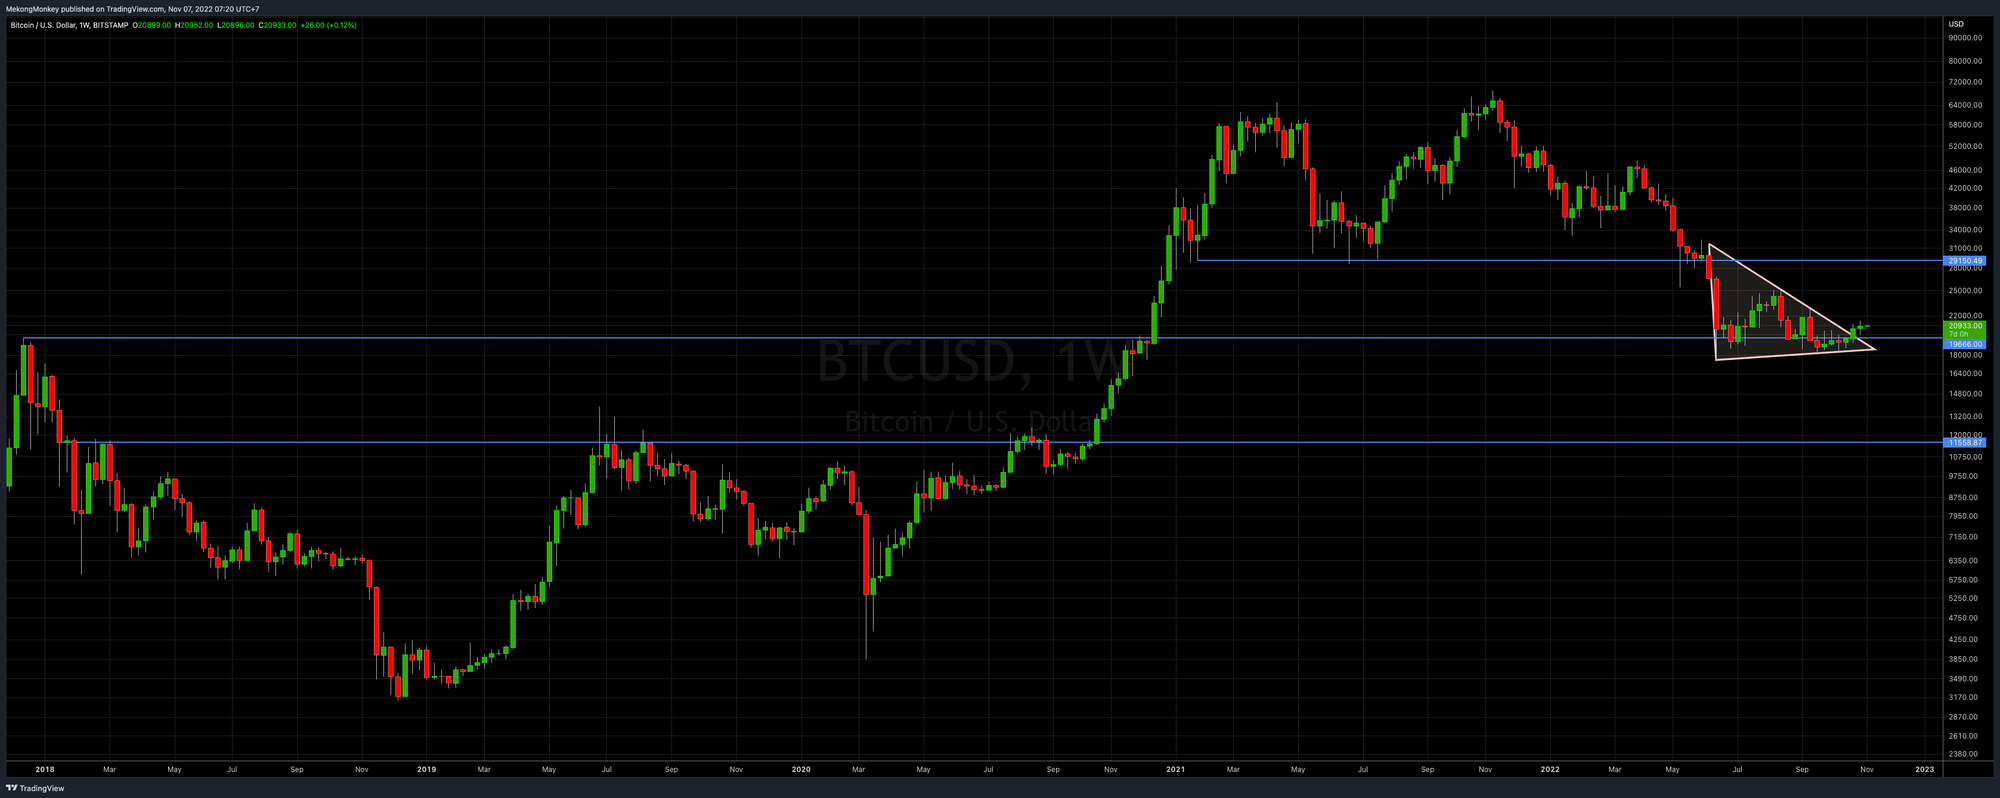
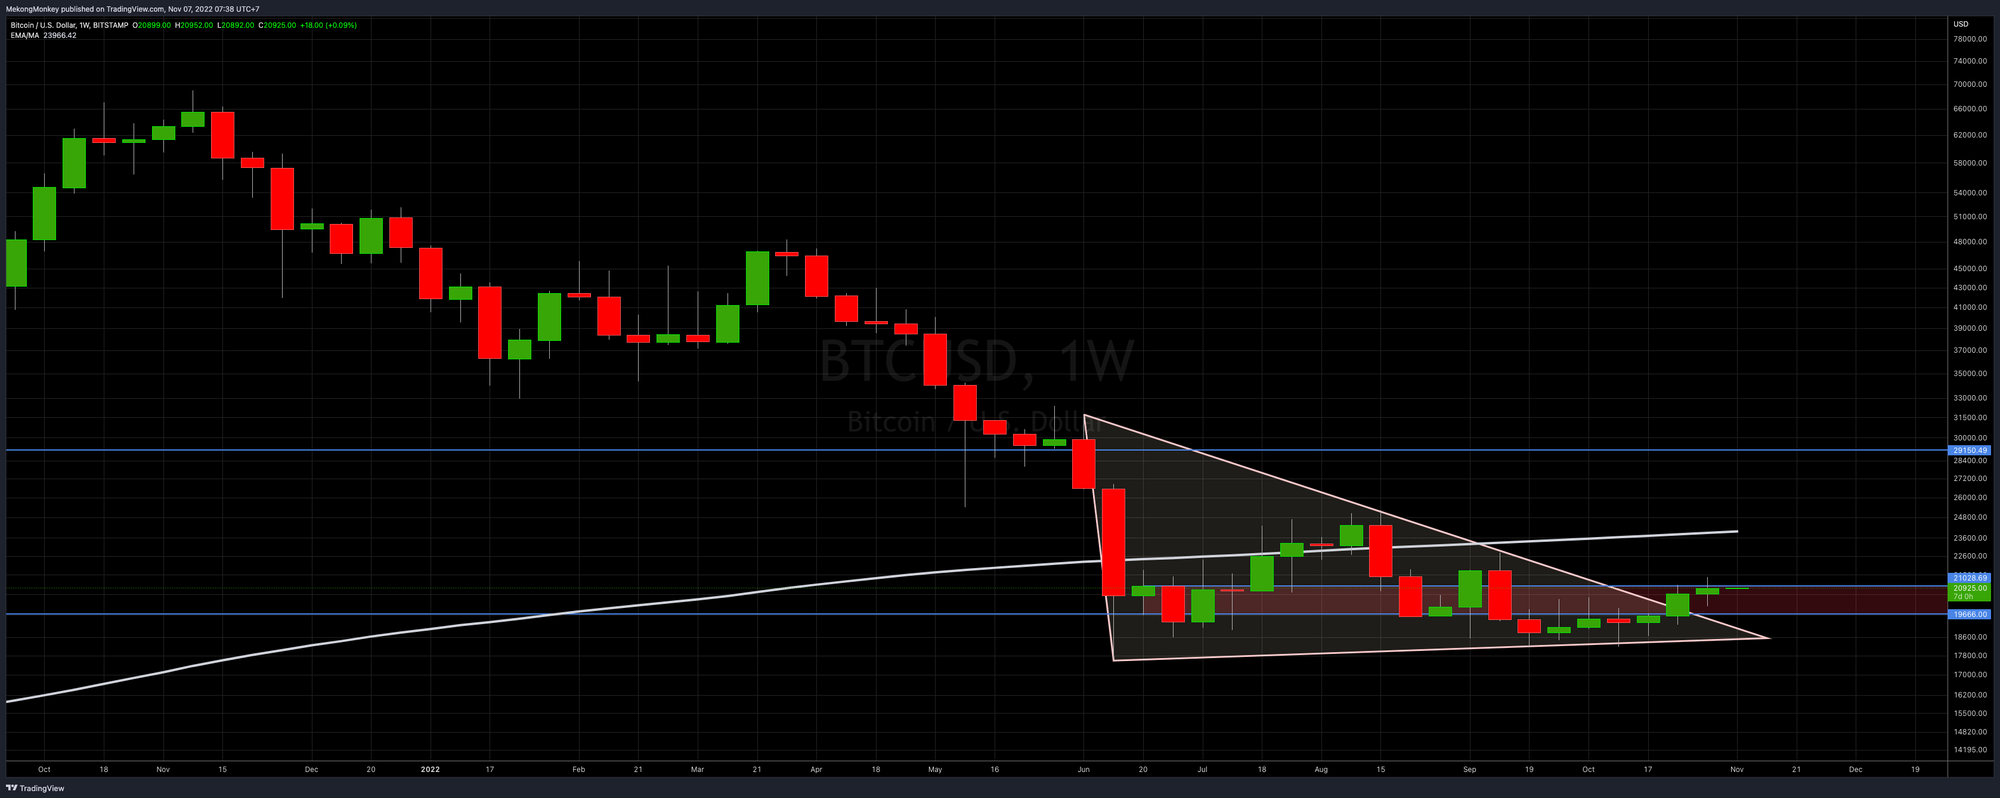
The blue lines indicate significant horizontal Support and Resistance levels (HSR). BTCUSD has been trading inside the pink triangle since June but has recently escaped from it through the upside.
If we look closer, it looks like this:
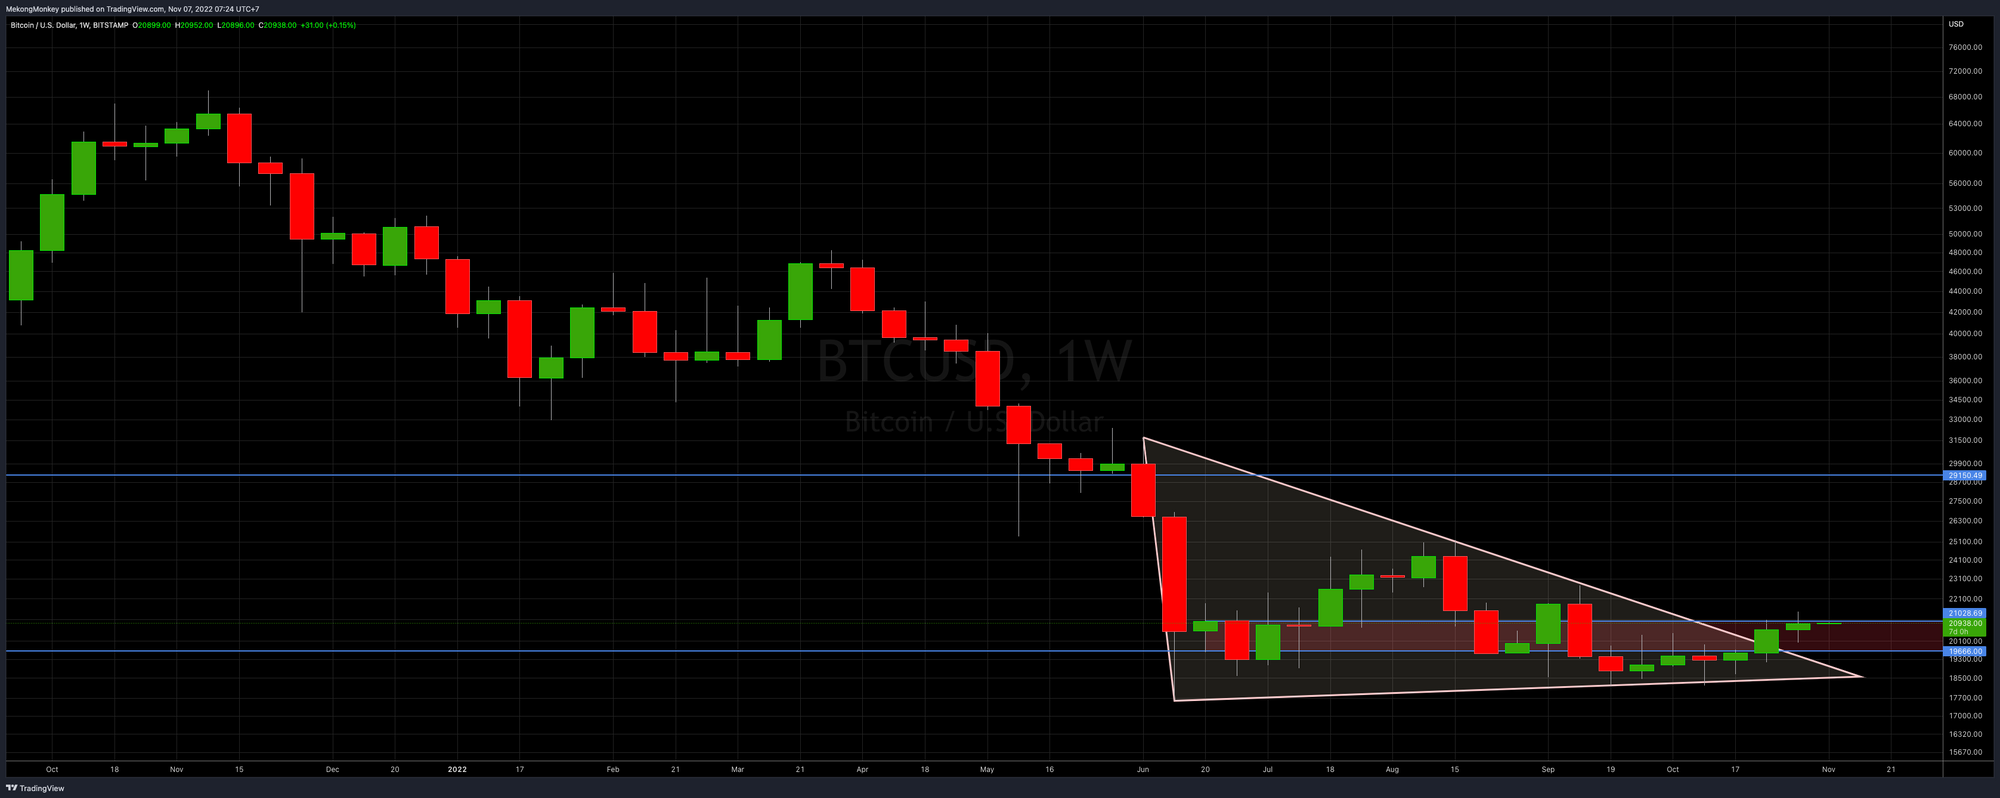
We’ve added another HSR level around 21K. Together with the 20K HSR level, it creates a Resistance-cluster between 20 and 21K (red area). BTCUSD has been unable to escape this area since arriving here in mid-June. The bad news is that we’re still inside this Resistance-cluster. The good news is that we broke out of the descending triangle, which, more often than not, leads to higher continuation. Also, BTCUSD has printed three green weekly candles in a row, which has not happened since December last year!
Now let’s take a peek at the momentum indicators. Here’s the RSI:
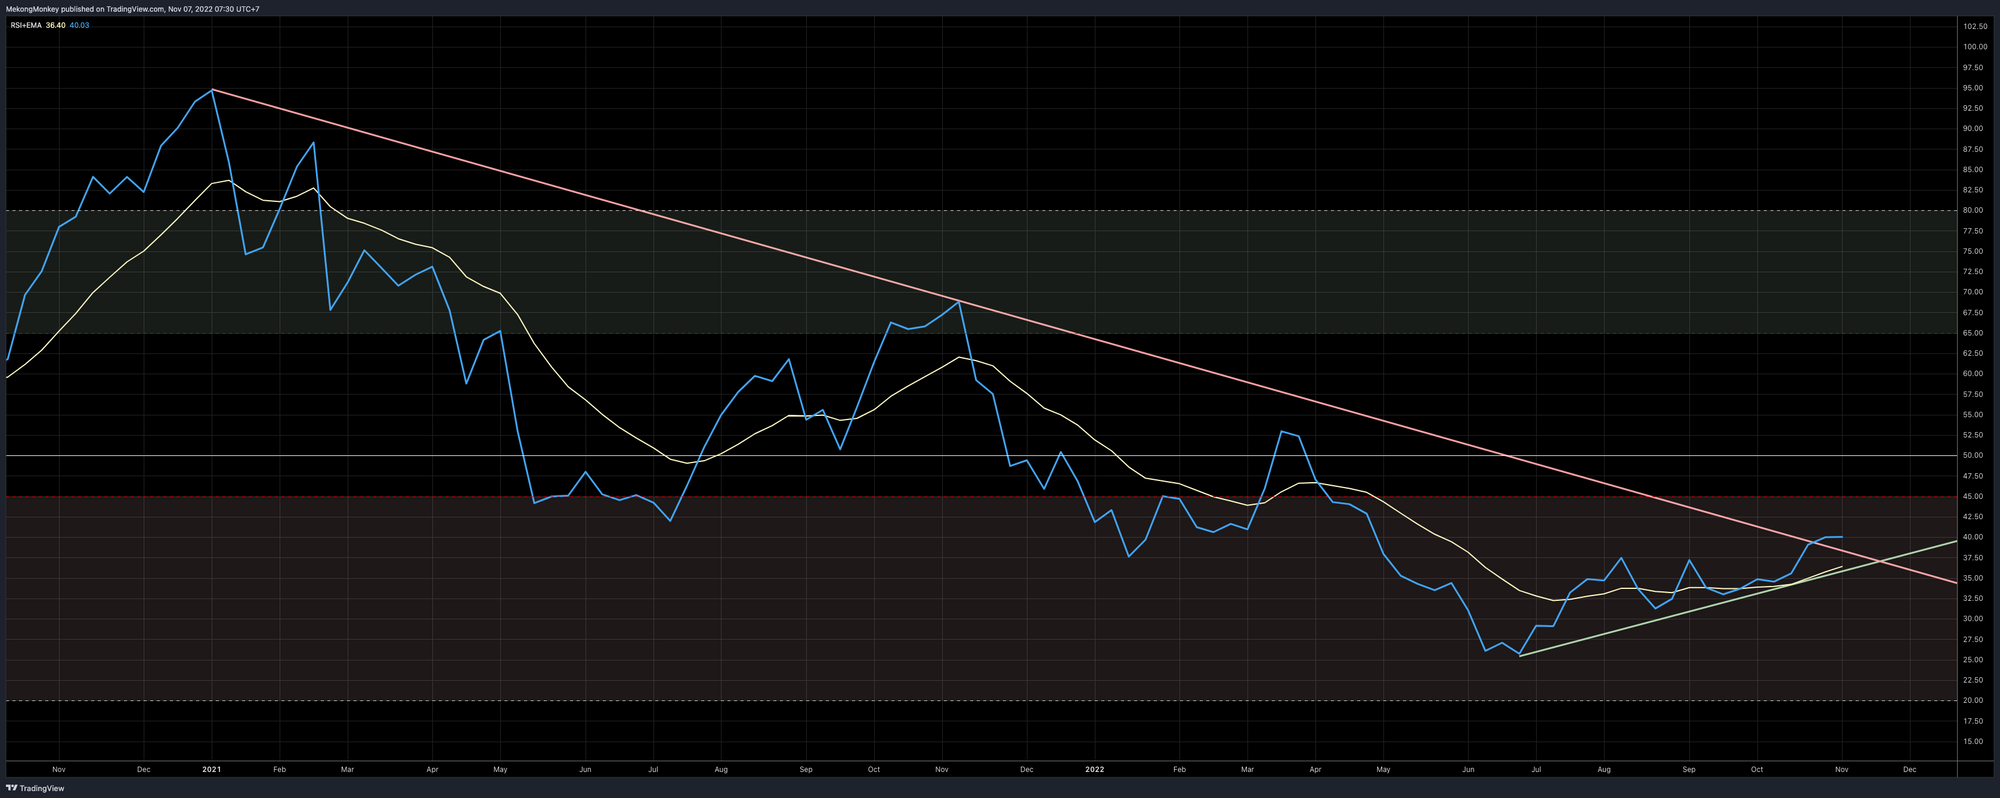
Notice how the RSI has been in a downtrend since January (red line) but has finally broken through it this week. The green line indicates that we’ve been trending up since late June. A promising signal for things to come.
The Stoch indicator fully supports this idea:
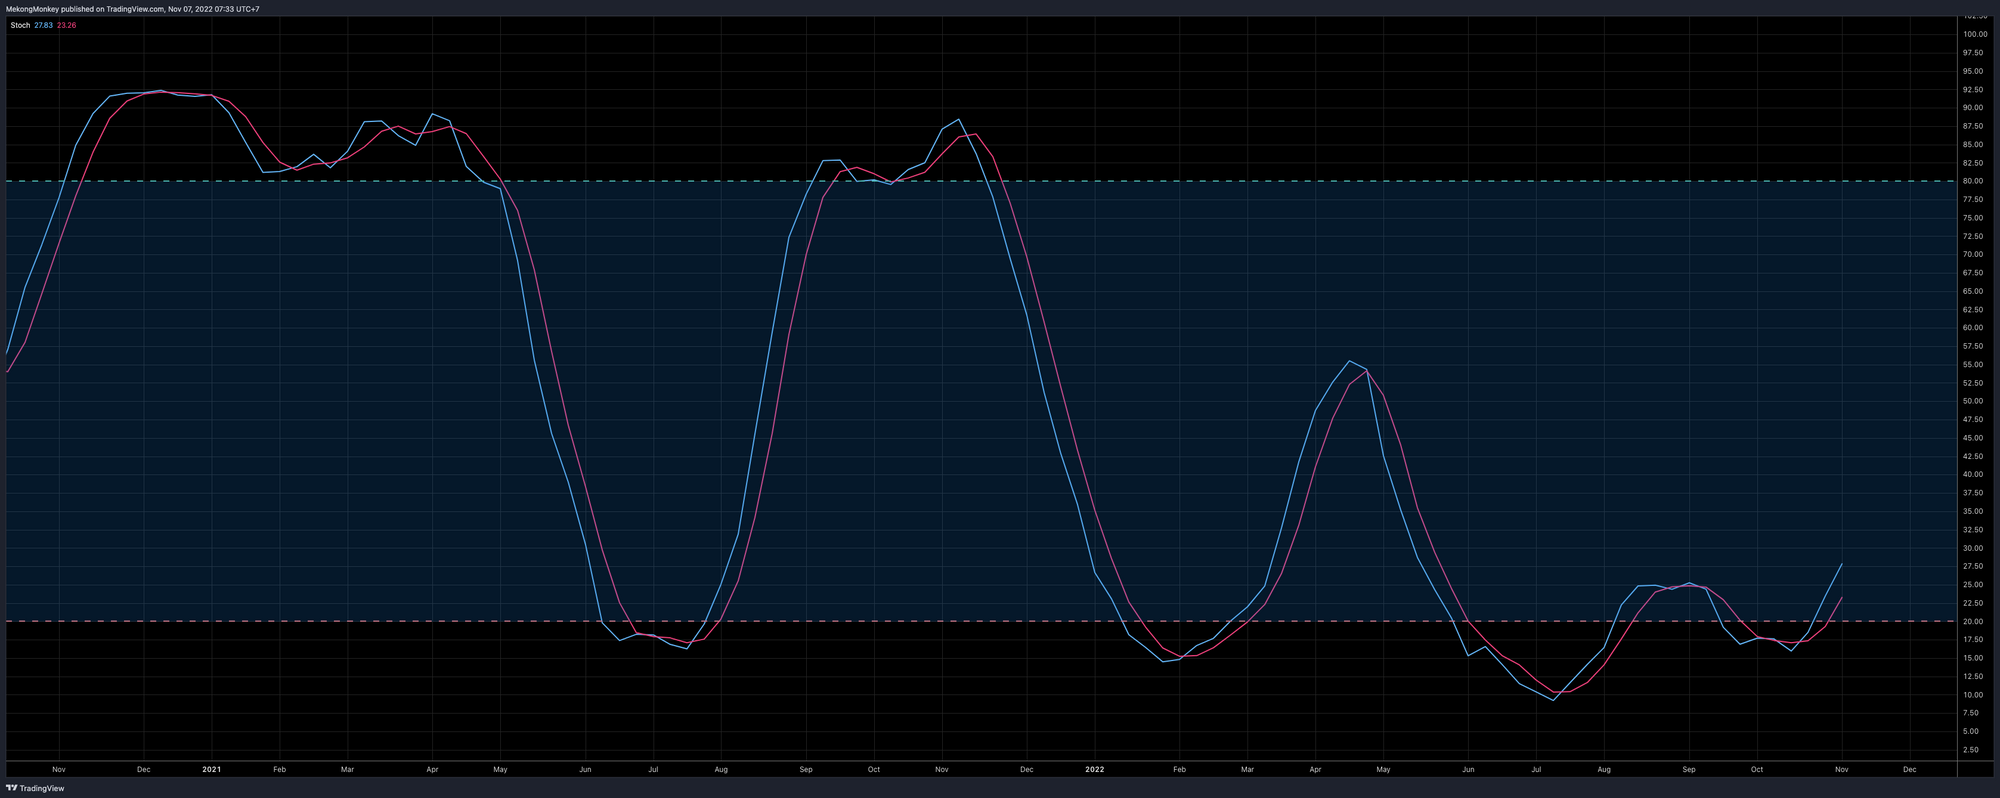
The Stoch generally moves up and down. Possibly to the green line on top (overbought conditions). Below the red line is oversold (much heavy selling is needed to get there). Now the Stoch has exited these oversold conditions. This usually means sellers are exhausted, and the price has room to run higher.
While price paints a muted bullish picture (escape from the triangle but still stuck inside the Resistance cluster sub-21K), momentum is starting to look bullish. Both RSI and Stoch suggest the price could move higher soon.
How high can we go?
In the chart above, we’ve added the 200 Week Moving Average (WMA). If BTCUSD can finally escape the Resistance cluster, the 200WMA is the next hurdle ahead. Currently, it sits around 24K. Suppose the price can flip the 200WMA back into Support. In that case, this opens the possibility of a return to bull markets where the next target sits around the 30K Resistance level.
A Peek at the Monthly
When October closed, we tweeted the following:
$BTCUSD at Monthly Support, respecting the historical bullish trend line (green). Move up towards the monthly 50 EMA (blue line), around 25K, the most likely path forward for November. Monthly Resistance around 35K. #Bitcoin pic.twitter.com/qDYIeBrie3
— MekongMonkey ∞/21M (@MekongMonkey) October 31, 2022
The Long Run
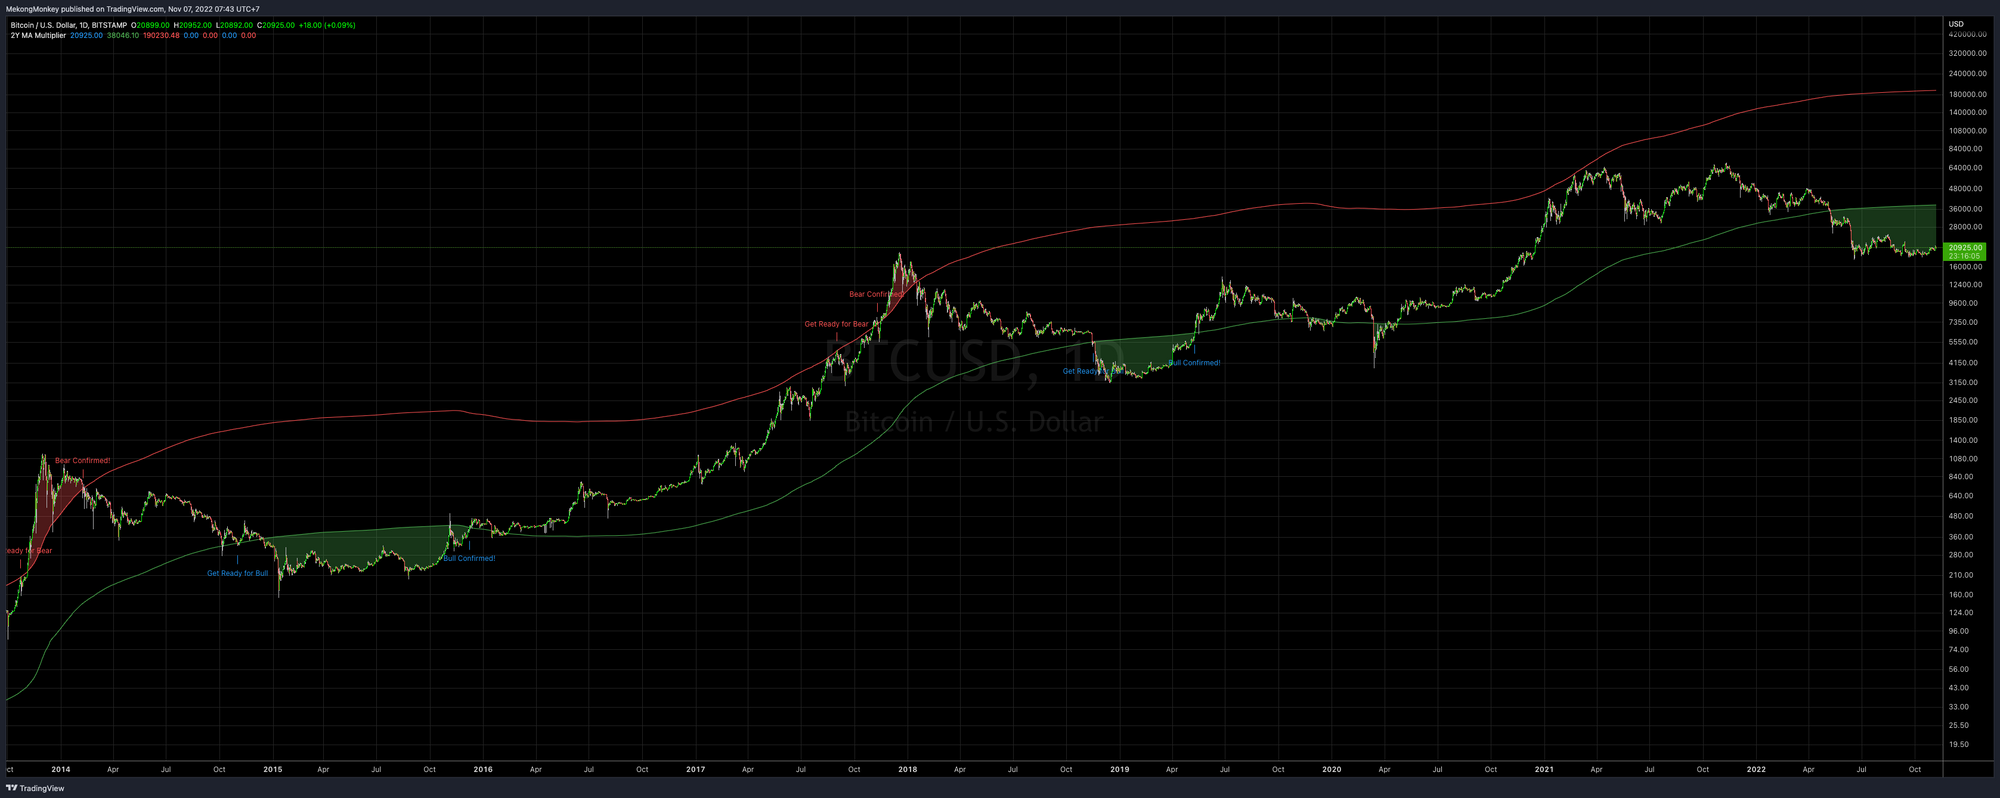
The 2-Year Moving Average (MA) Multiplier is an easy long-term investment tool. Historically, BTCUSD oscillates between its 2-Year Moving Average (730 days, green line) and its 2-Year Moving Average x 5 (730 days x 5, red line).
Buying bitcoin when the price drops below the 2yr MA has generated outsized returns. Selling bitcoin when the price goes above the 2yr MA x 5 has been effective for taking a profit. This tool works because as bitcoin is adopted, it moves through market cycles. These are created by periods where market participants are over-excited, causing the price to over-extend, and periods where they are overly pessimistic, where the price over-contracts. This means waiting to buy until BTCUSD reclaims $40K and selling around $200K. That should be a pretty straightforward long-term investment. A more aggressive approach might be to dollar cost average as long as BTCUSD trades below the green line.
To bring it all together:
BTCUSD has been teasing a breakout above 21K but has closed below it once again. Three green candles in a row are promising, and the momentum indicators turned very bullish. Continuation to the upside is more likely, with the 200WMA around 24K as the first target.
An Inspirational Tweet before you go:
You take the blue pill... the story ends, you wake up in your bed and believe whatever you want to believe.
— Dylan LeClair 🟠 (@DylanLeClair_) November 1, 2022
You take the red pill... you stay in Wonderland, and I show you how deep the rabbit hole goes.pic.twitter.com/6B7jcYa58z
Have a great week, dear friends, and take good care of yourself. You can reach us on Twitter, Telegram, or e-mail if you have any comments, questions, or suggestions.
Greetings from Phnom Penh, and talk again soon!

Not trading advice. You are solely responsible for your actions and decisions.